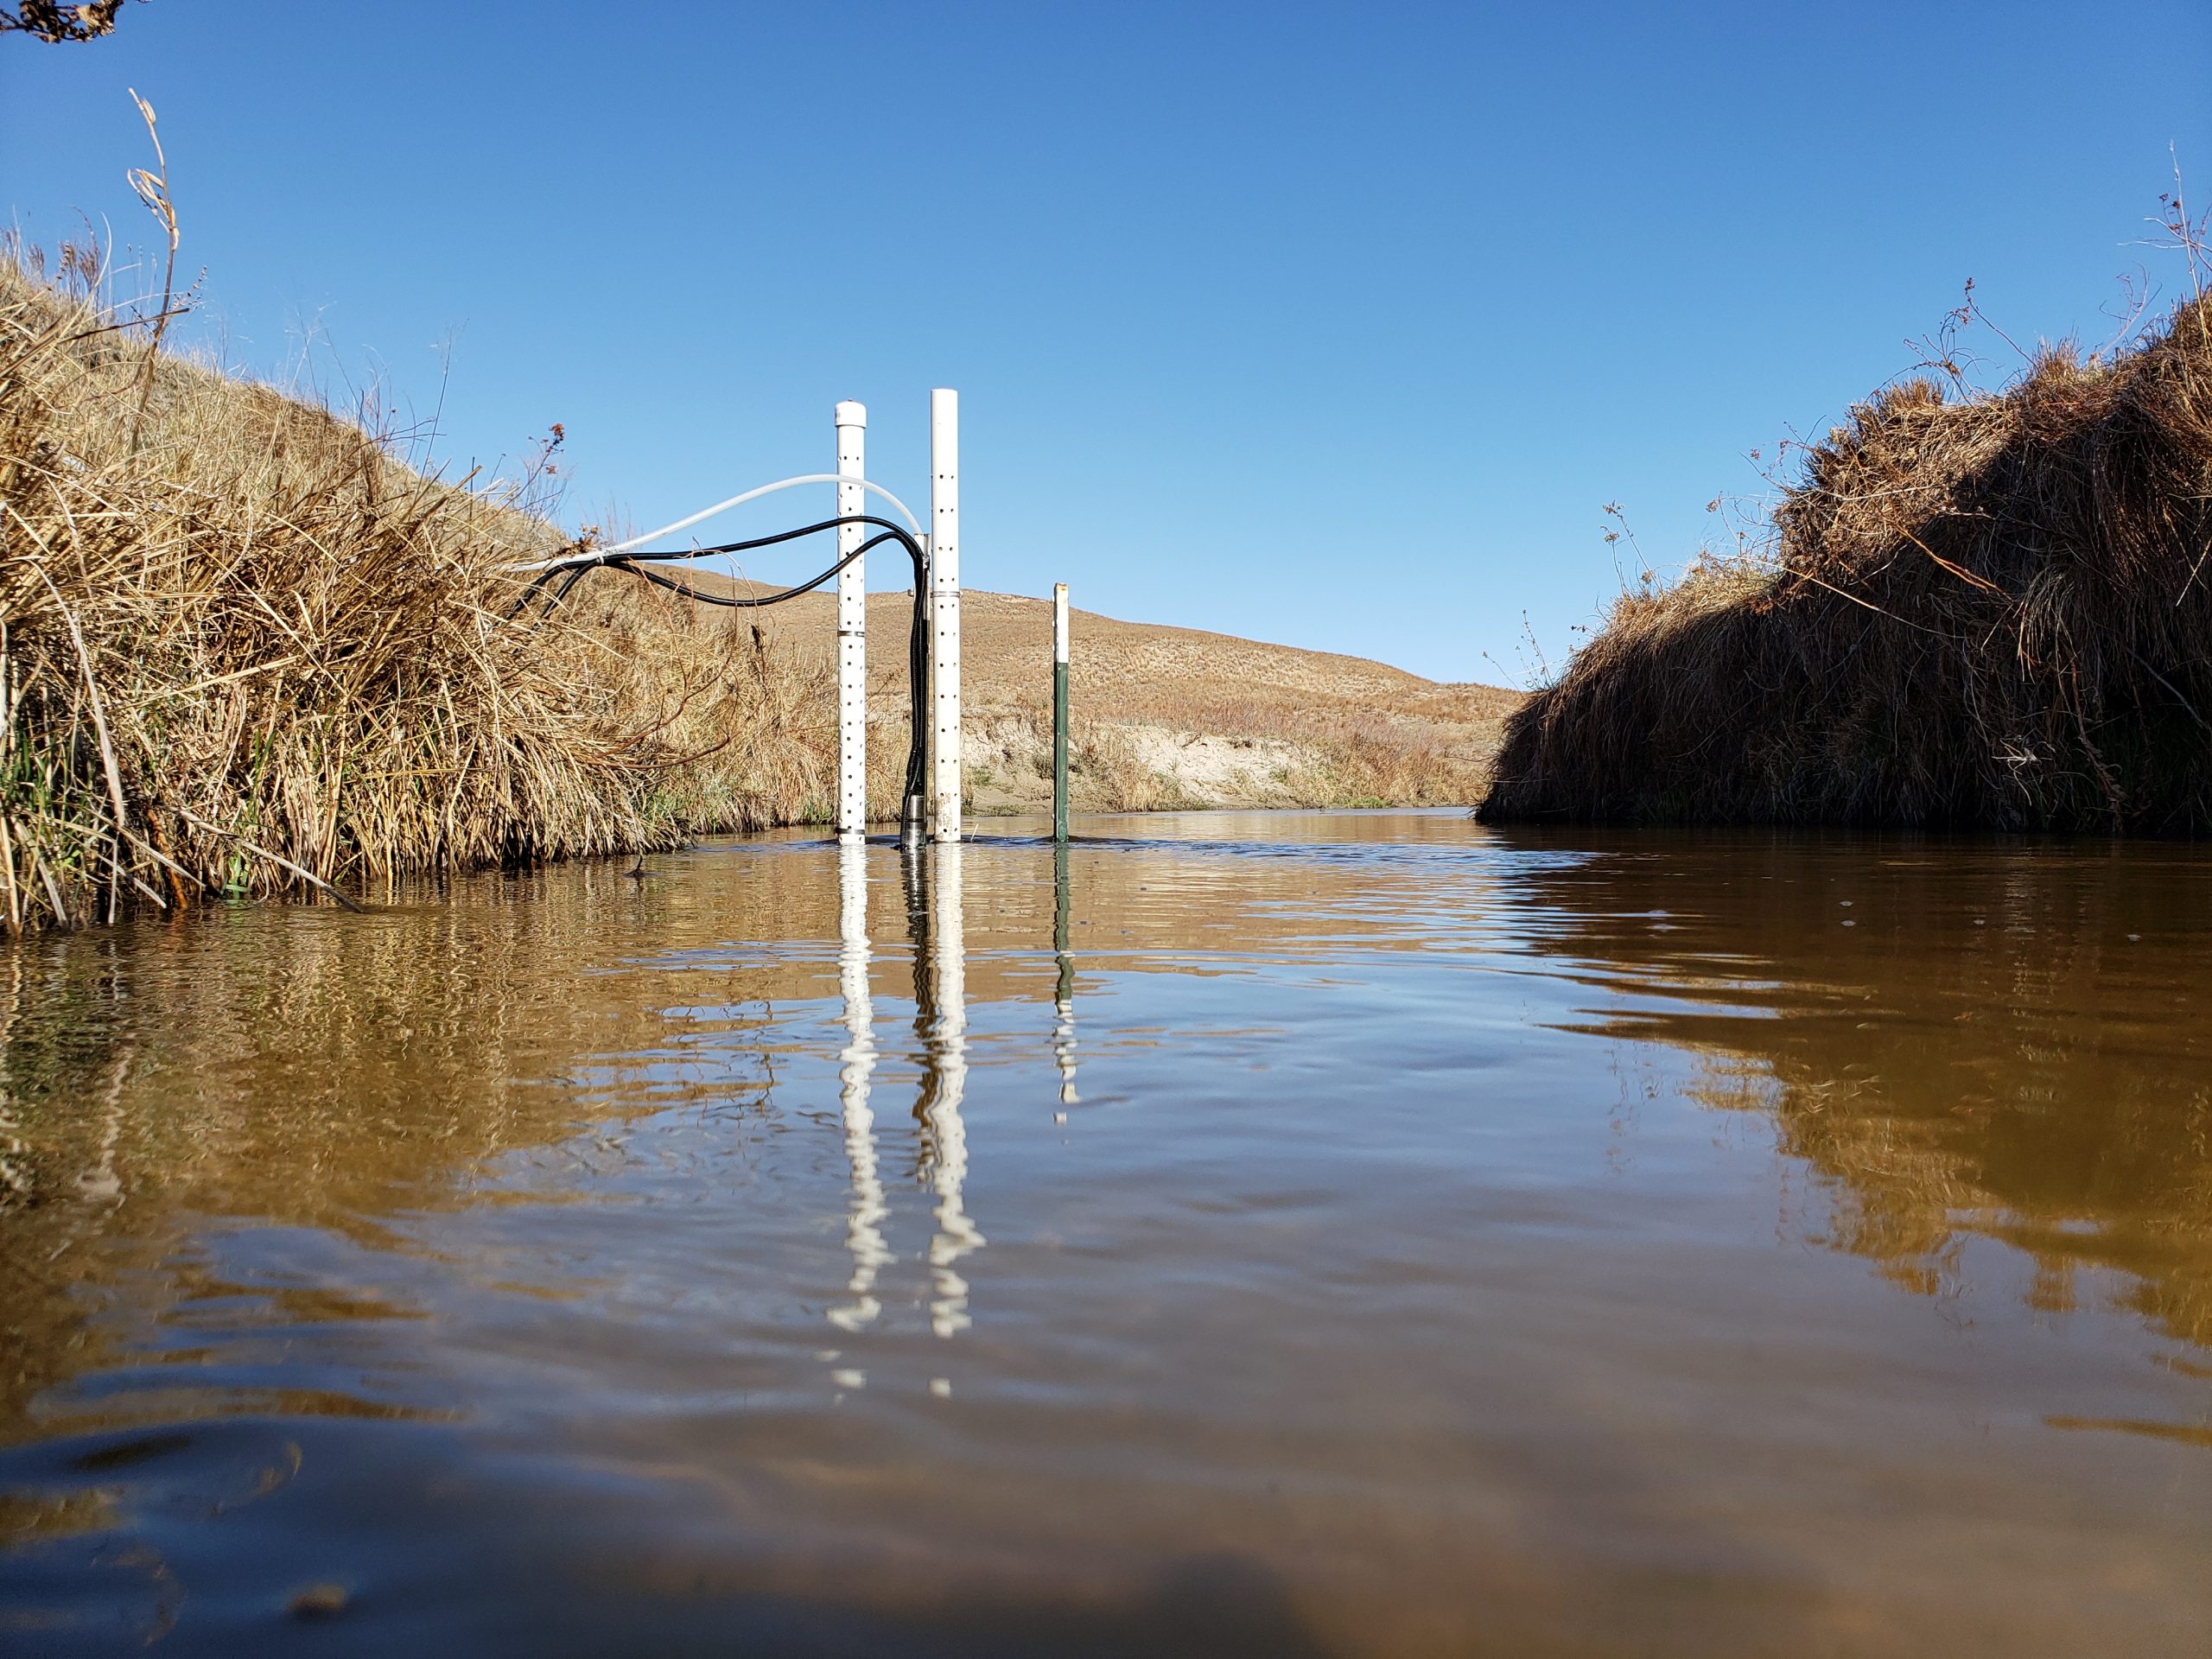
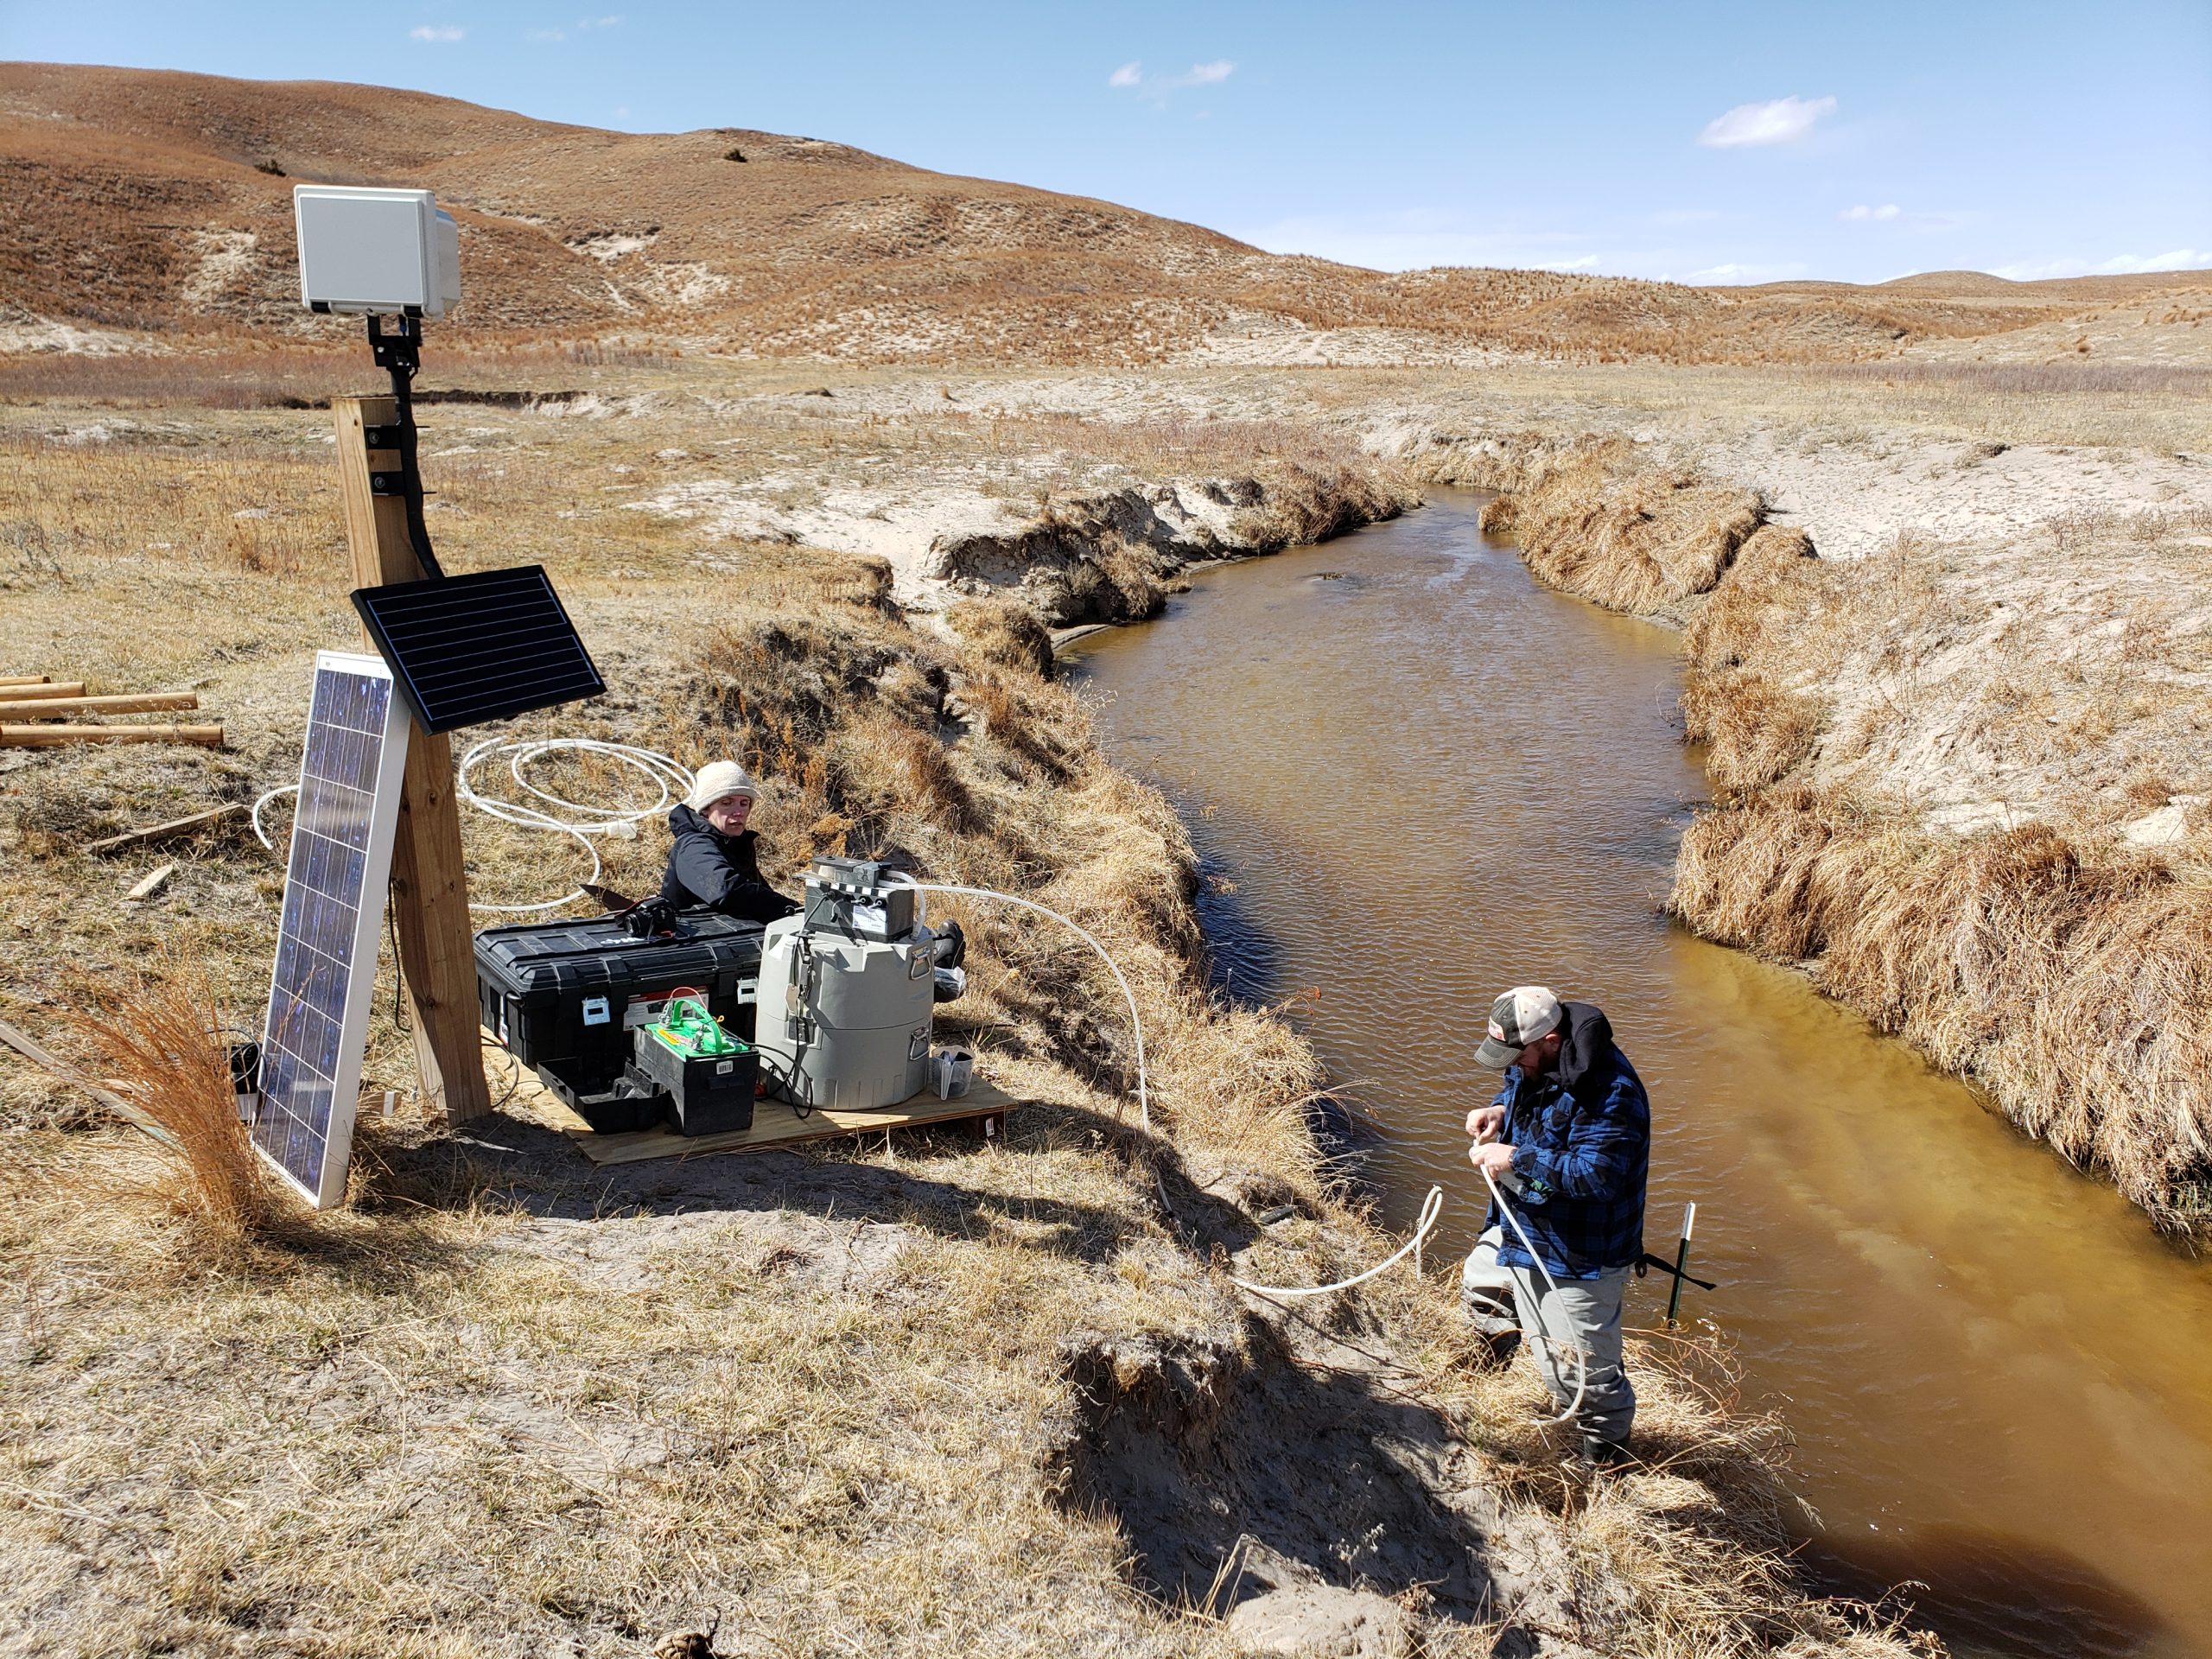
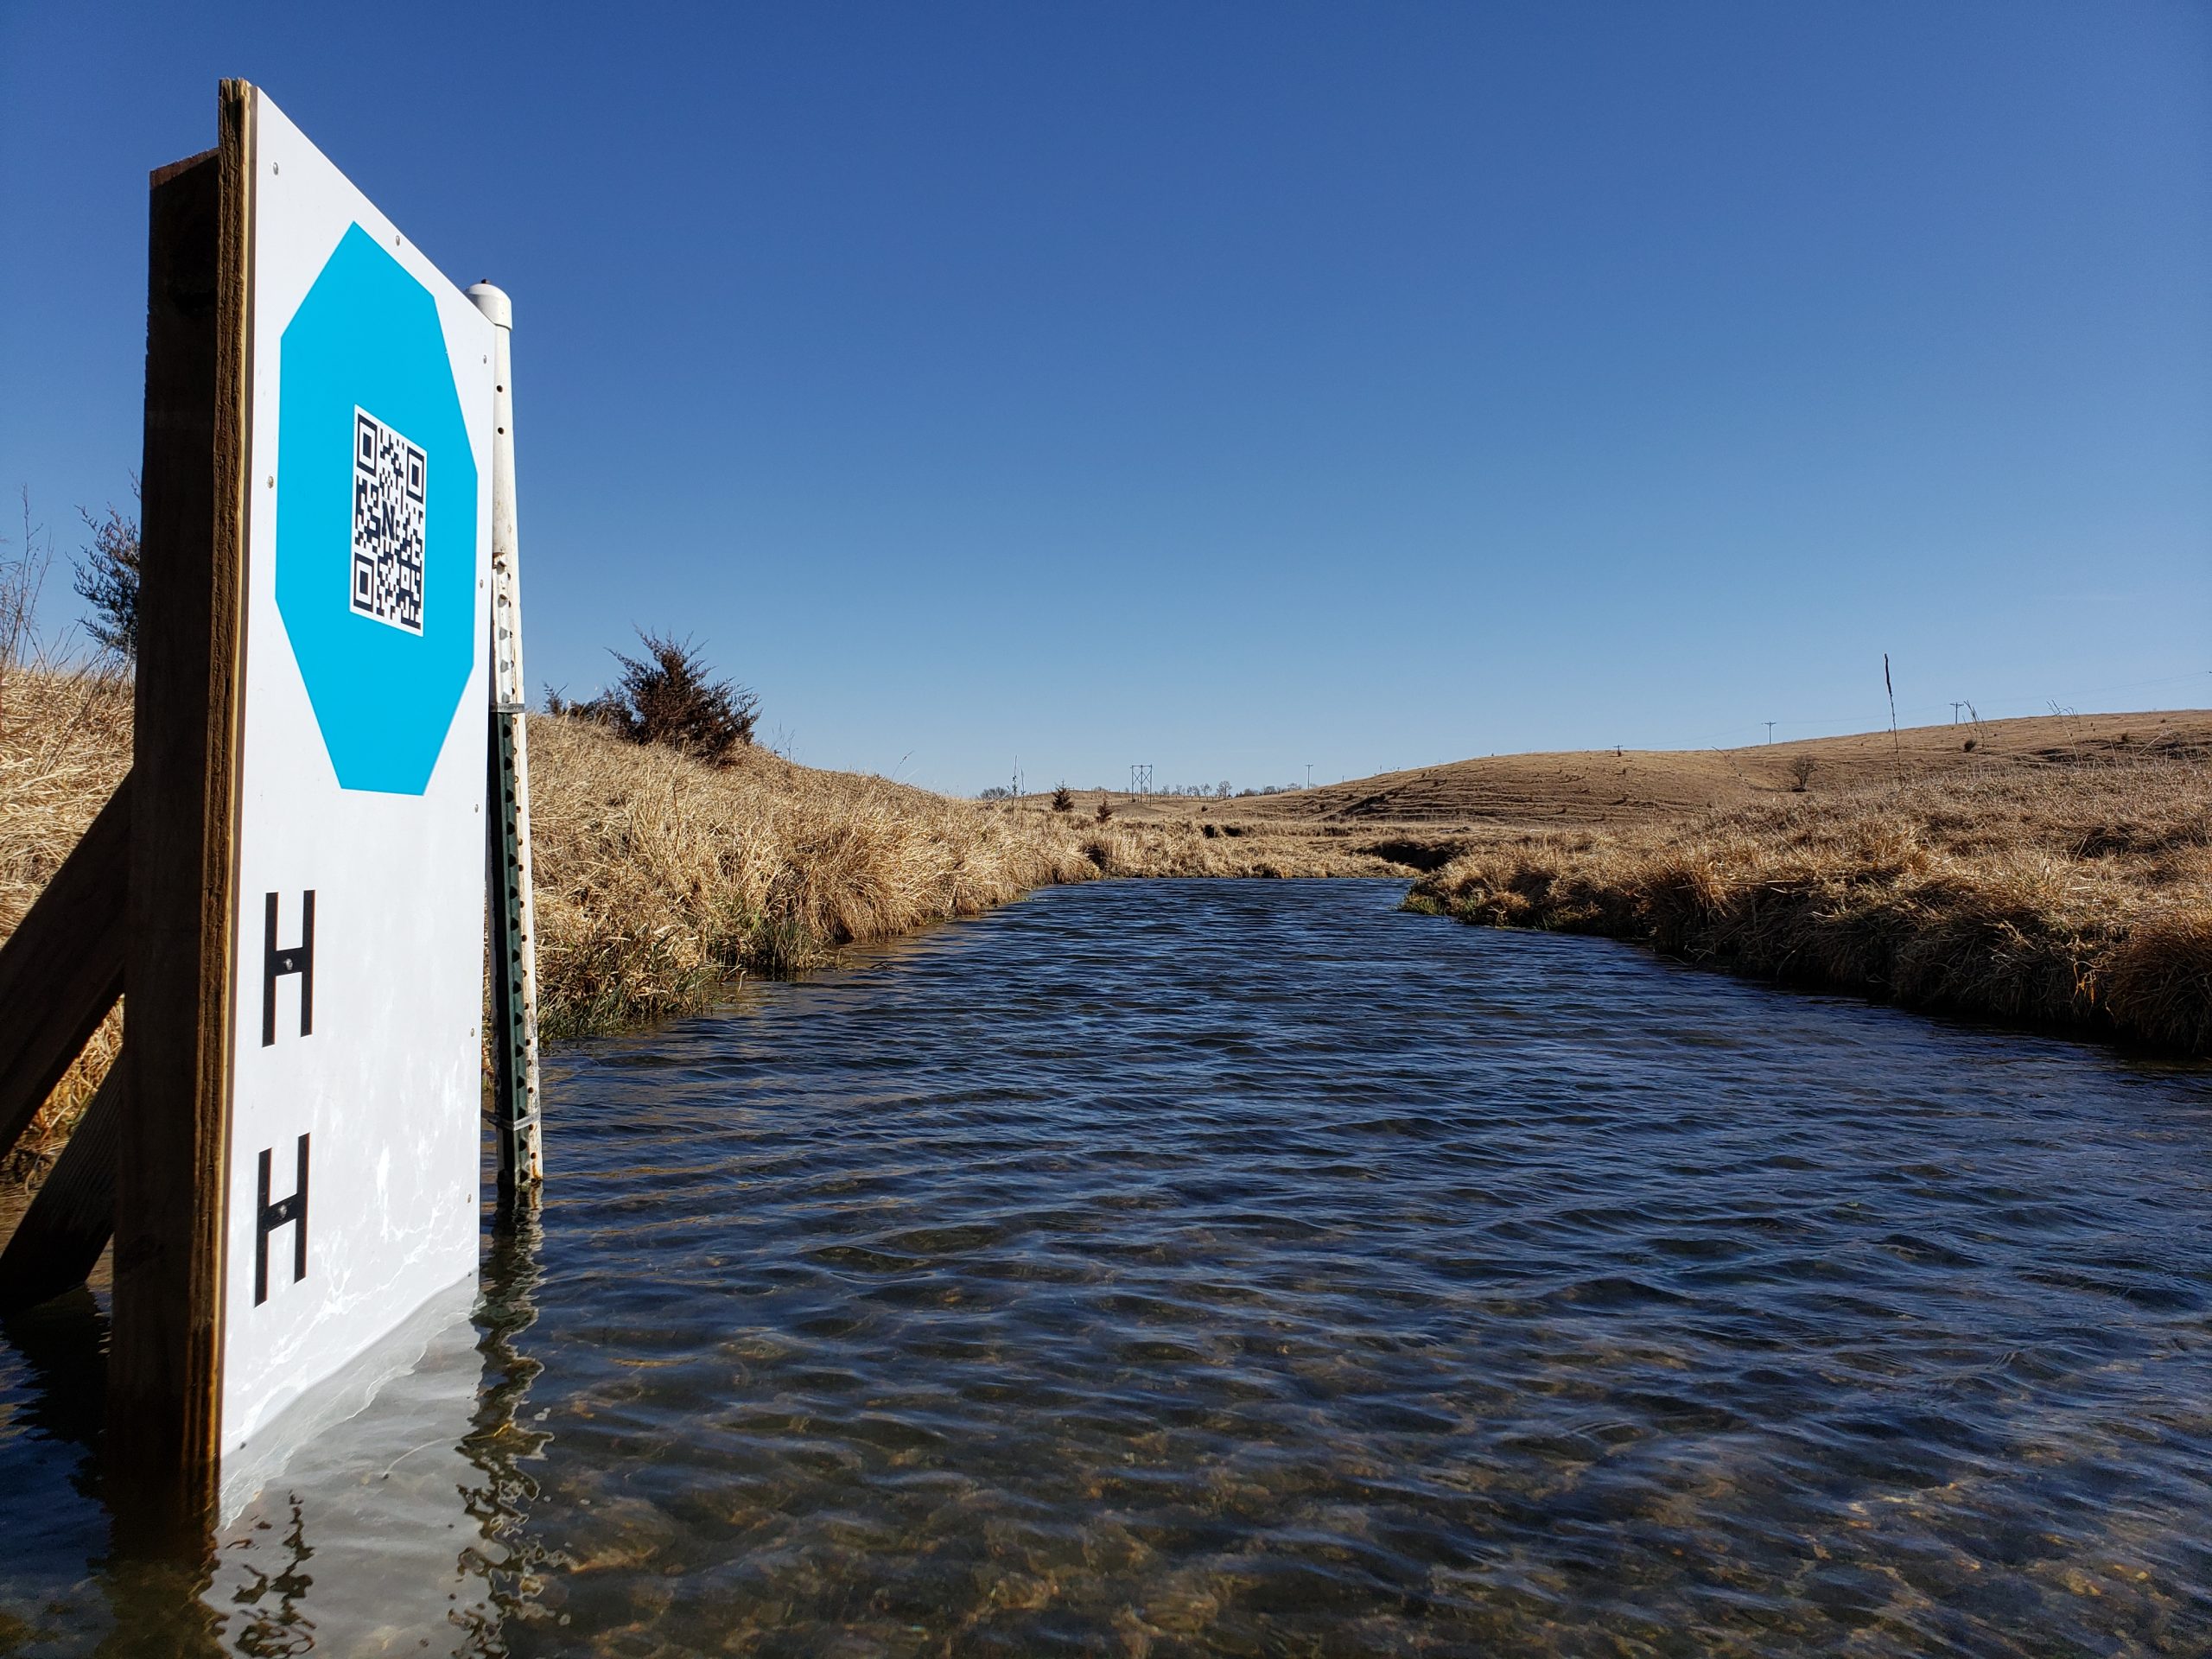
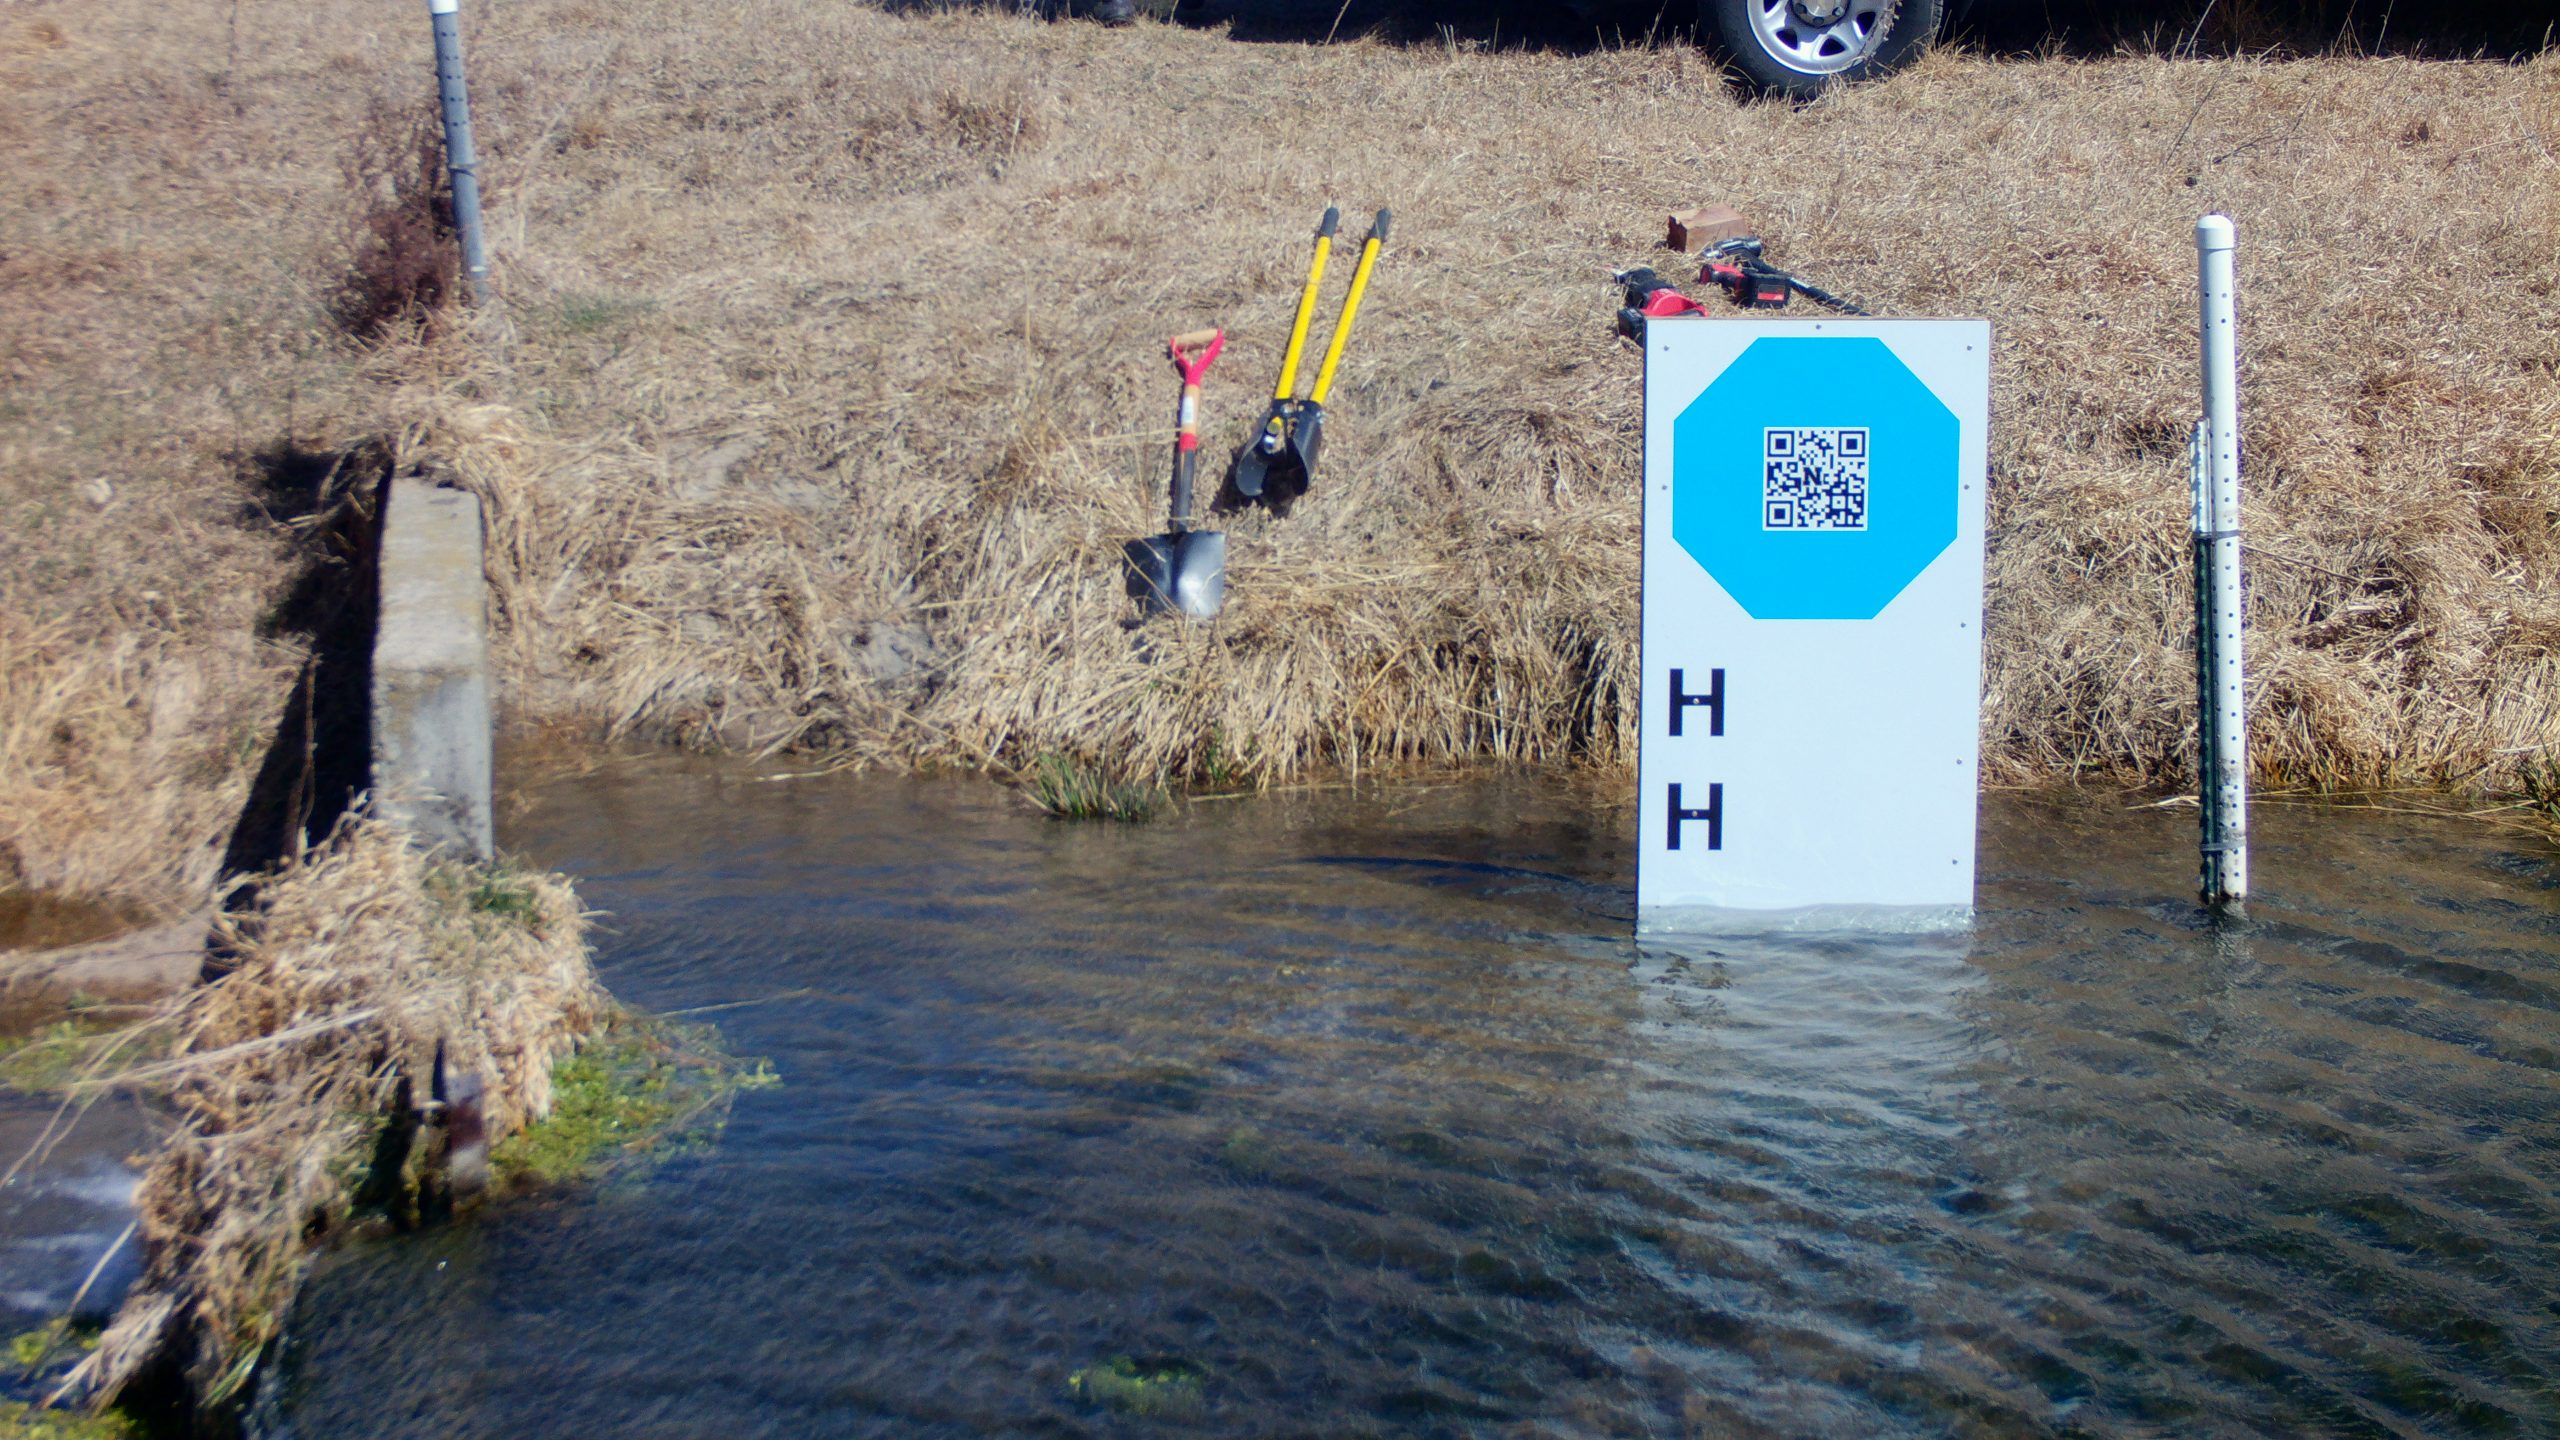
Since 2010, the GaugeCam team has been working on open-source software for ground-based time-lapse imagery (recently referred to by a colleague as “camera trap hydrology”).
The project started in François Birgand’s lab at North Carolina State University. GaugeCam was my undergraduate research project and Ken Chapman wrote the open-source software to measure water level in highly conditioned time-lapse images. We published a paper in 2013 (Gilmore et al. 2013, Journal of Hydrology) showing potential precision of +/- 3mm, or about the height of a meniscus, in carefully controlled laboratory conditions. Application of GaugeCam showed increased uncertainty in a precisely installed and well-maintained field site in a tidal marsh in eastern NC (Birgand et al. 2022, PLOS Water). Uncertainty is still reasonable compared to other common water level monitoring methods. The current iteration of this mature, open-source software for measuring water level is the GaugeCam Remote Image Manager 2 (GRIME2), as described in a technical note in Water Resources Research (Chapman et al. 2022). More details, including major recent improvements to the ease of installation, are available at https://gaugecam.org/grime2-details/.
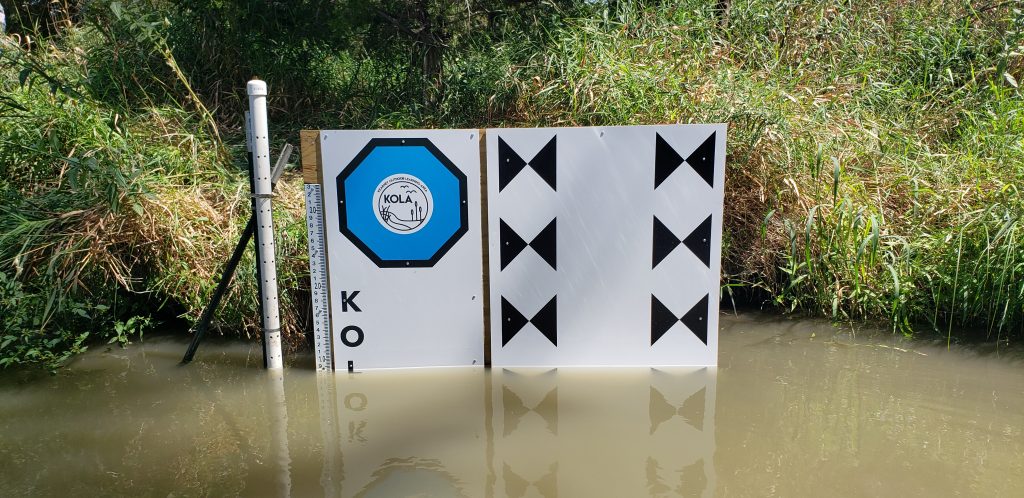
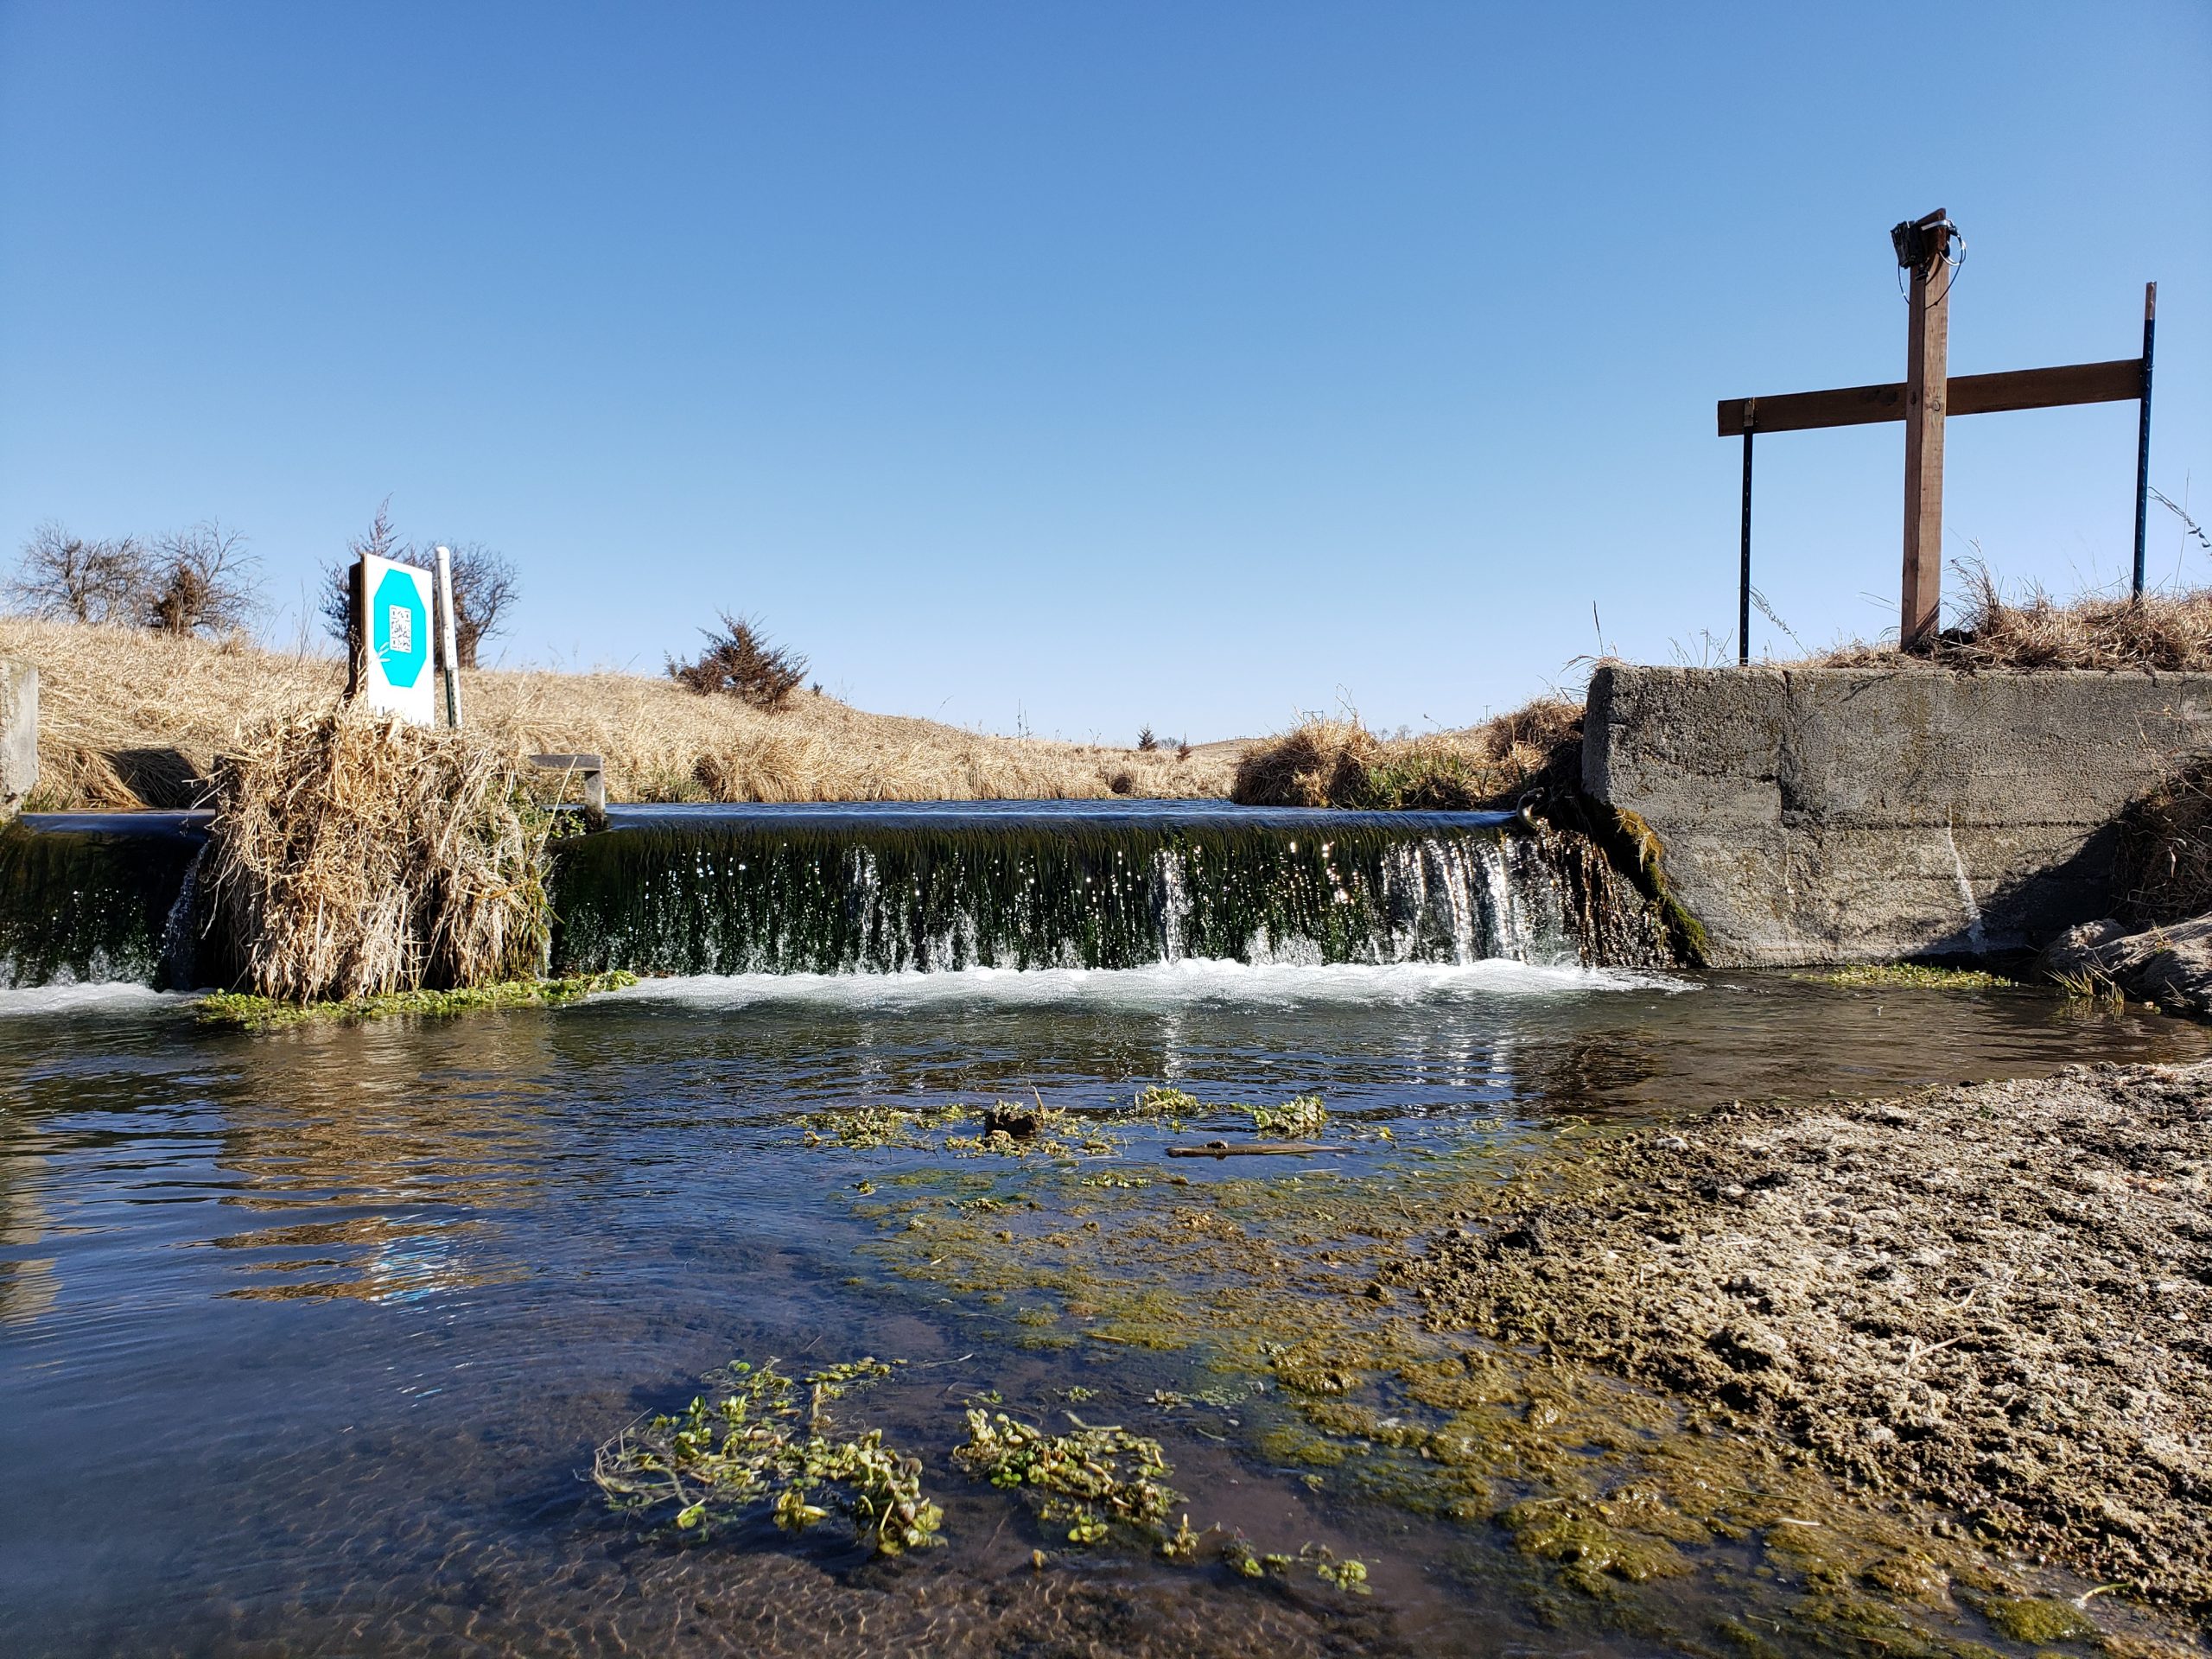
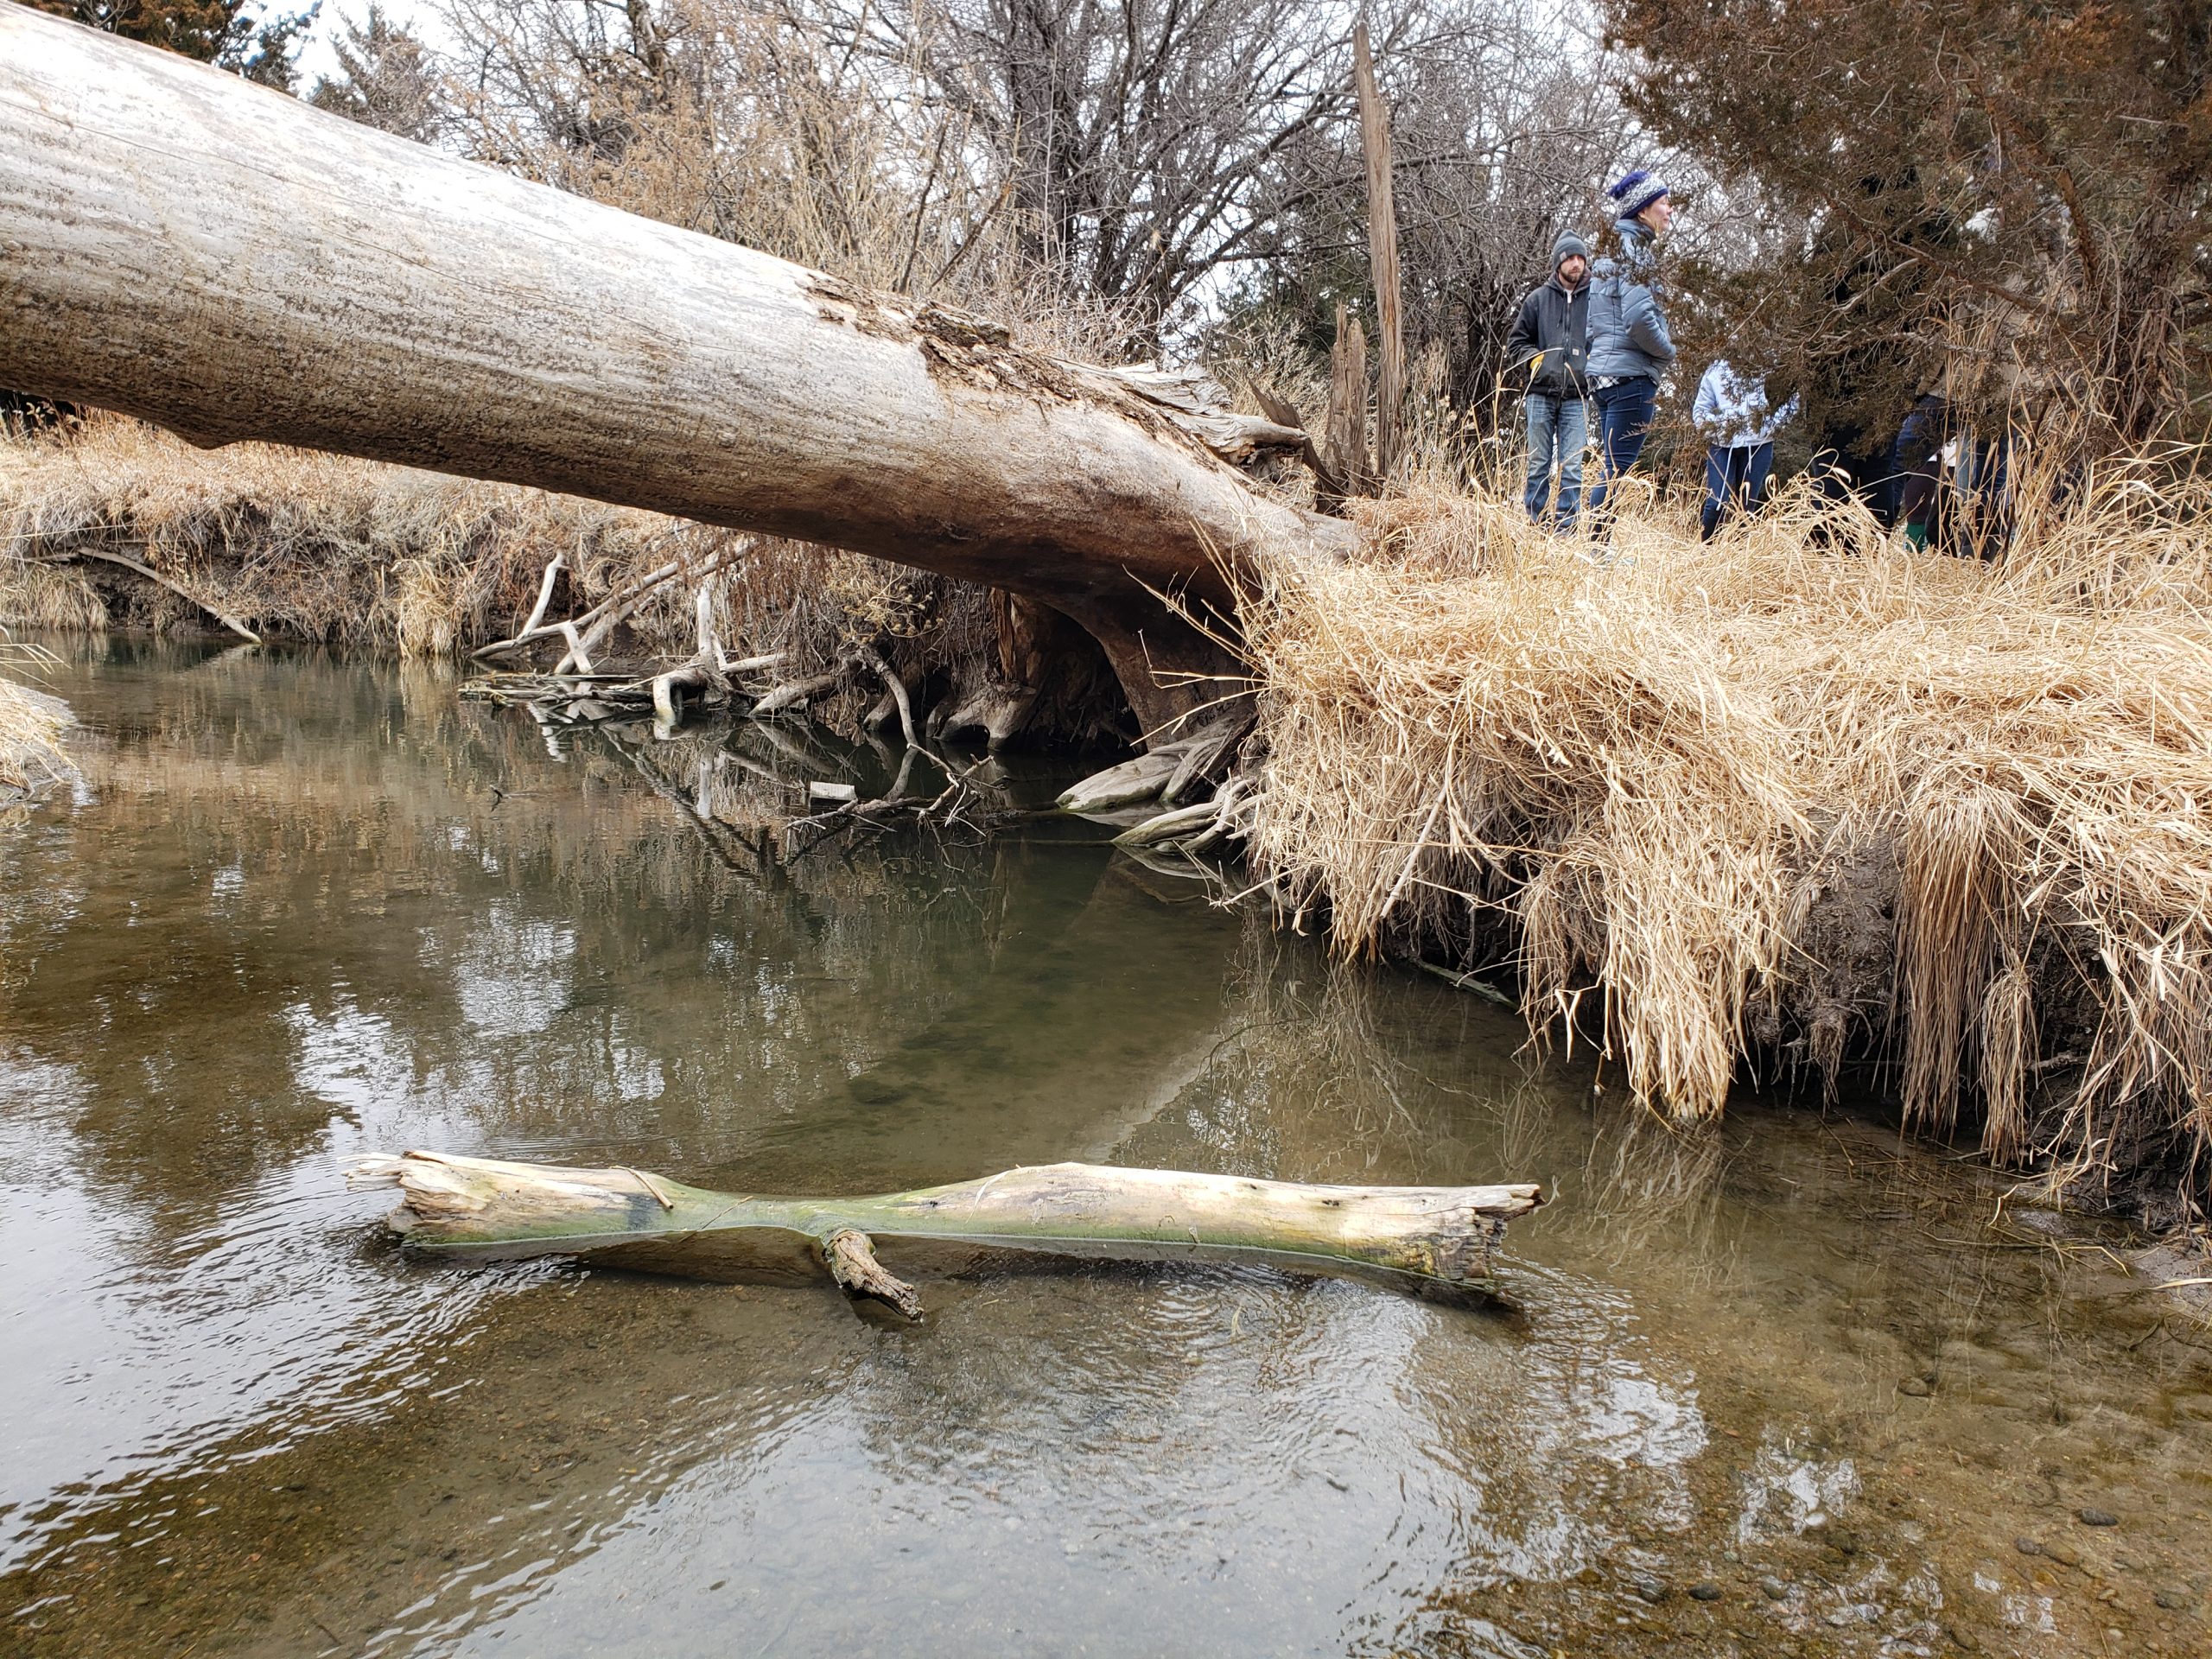
More recently, we have been working with Mary Harner (University of Nebraska at Kearney, see https://witnessingwatersheds.com) and her colleagues with the Platte Basin Timelapse (PBT) project (https://plattebasintimelapse.com). PBT has over 3 million high-resolution (DSLR) hourly daytime images from 60+ cameras across the Platte River basin. These images are available to University of Nebraska researchers for research and teaching purposes. Mary and her colleague Emma Brinley-Buckley had previously published research based on PBT imagery, for example, extracting the extent of wetland inundation from imagery. Similarly, Ken Chapman (now a PhD candidate at UNL) used PBT imagery to fill simulated data gaps in USGS stream gauge data (withdrawn preprint in HESS, now revised and in review in PLOS Water).
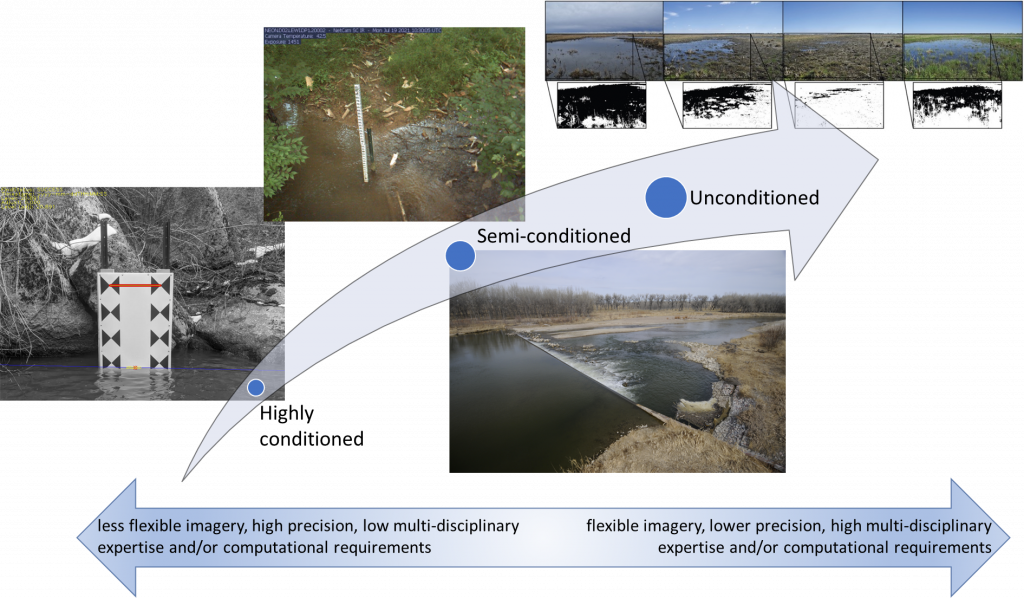
Thus, the inspiration for GRIME-AI, a software suite that will allow much broader application of time-lapse (camera trap) imagery in hydrological and ecological studies. In short, GRIME-AI is intended to help us move across the spectrum of potential image types that can be acquired from fixed ground-based cameras. The figure below shows this vision, starting with highly conditioned GaugeCam water level imagery on the left, to more flexible (but more difficult to handle) unconditioned imagery on the right. UNL PhD student John Stranzl is the lead programmer on GRIME-AI. More information is available at https://gaugecam.org/grime-ai-details/.
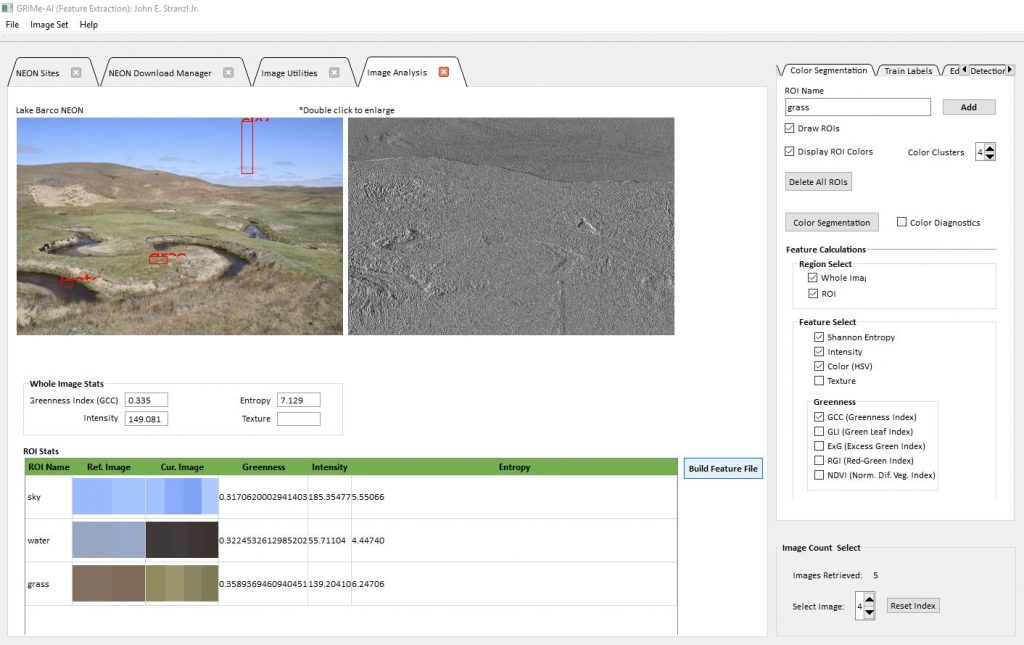
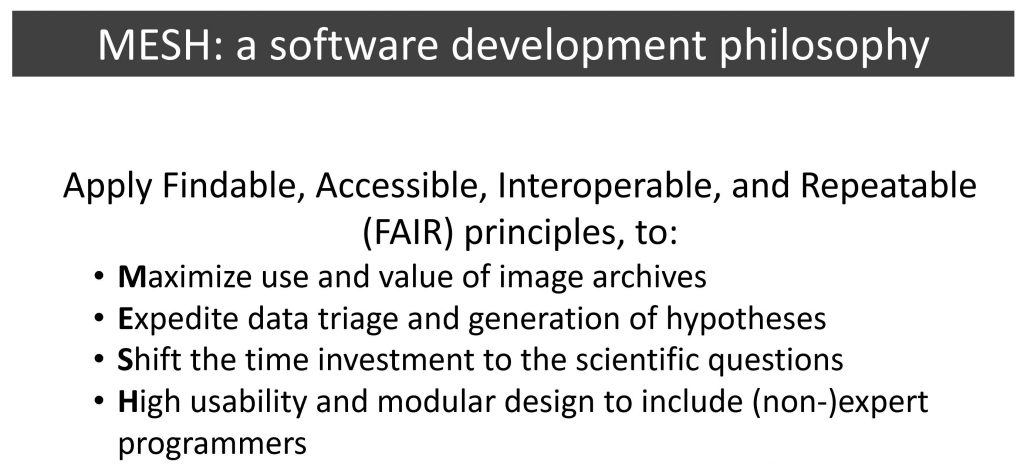
Long-term, our goal is for GRIME-AI is an open-source ecosystem that has the simplicity for new (very low barrier to entry for non-programmers) combined with the opportunity for experienced programmers to contribute to the capabilities of the software. A key guiding concept for GRIME-AI is that it should reduce mundane and repetitive tasks to the bare minimum, while still being powerful and flexible. Our software development philosophy is below.
Early features enabled in GRIME-AI are as follows:
- Automatic download of NEON data
- Automatic download of PhenoCam images for NEON sites
- Image triage (removal of dark and/or blurry imagery), with csv report
- Visualization (overlays) of common edge detection algorithms (Canny, Sobel, ORB, etc.)
- Custom region of interest (ROI) placement on reference image
- Calculation of scalar image features for each ROI and whole image, including:
- Color cluster analysis for each ROI and whole image
- Greenness calculations for each ROI and whole image
- Intensity and entropy for each ROI and whole image
- Generation of csv with all selected scalar image features extracted for folder(s) (recursive) of images
The obvious next steps are:
- Data fusion (combining other sensor data with scalar image features extracted in GRIME-AI)
- Anchoring images/ROIs to account for camera movement
- Capabilities to build classifiers from fused datasets
- Automated image segmentation
