Here’s one example test image from the Kearney Outdoor Learning Area (KOLA). This segmentation model was tuned as part of our USGS-funded project looking at 11 HIVIS sites.
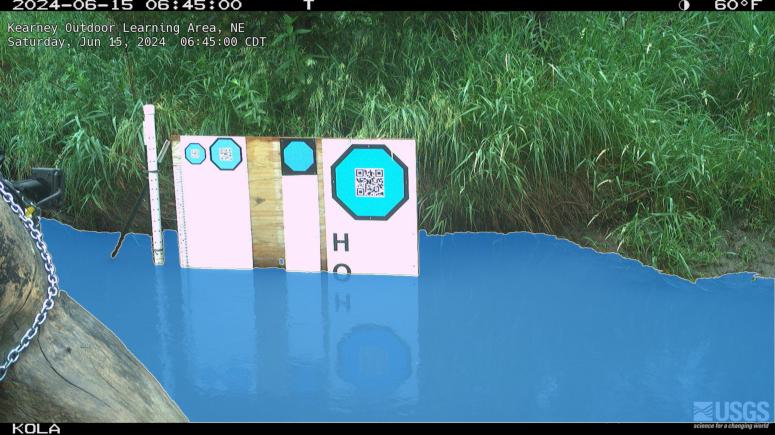
Here’s one example test image from the Kearney Outdoor Learning Area (KOLA). This segmentation model was tuned as part of our USGS-funded project looking at 11 HIVIS sites.
Planning ecological and/or hydrological research project using trail cams? If so, you might be wondering about which camera and mounting system to use. We have some ideas. But first, here are some helpful references from groups that have many years of experiences with camera traps and ecohydrological monitoring:
Learn from Andrew Richardson’s account of PhenoCam’s history and lessons learned from operating a large scientific camera network: https://doi.org/10.1016/j.agrformet.2023.109751
Get inspired by Platte Basin Timelapse’ artistic time-lapse camera network, oriented toward conservation storytelling in support of science: https://plattebasintimelapse.com/timelapses/
Explore streams and rivers on the United States Geological Survey’s HIVIS site: https://apps.usgs.gov/hivis/
Honestly, the groups above have more experience installing time-lapse cameras than we do. That said, we have been learning and are happy to share the approach we are now using at stream monitoring sites like the Kearney Outdoor Learning Area (KOLA).
The Camera:
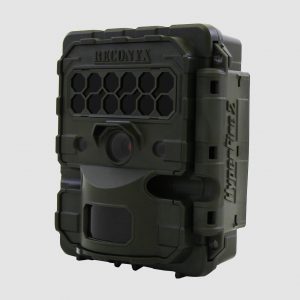
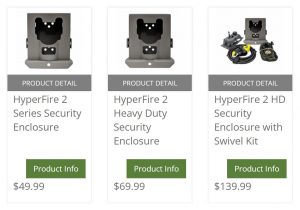
Our current preference is the Reconyx Hyperfire 2 Professional camera.
Why “Professional”? These cameras are $60 more than the standard Hyperfire 2. Based on the Reconyx comparison tool, here are key differences.
The Security Enclosure:
A good lock and security enclosure are important for most sites. But we also like the Reconyx security enclosure for another reason: image stability. Minimizing camera movement is one of the most important considerations for effective monitoring! Of course, a security enclosure does not guarantee a perfectly stable camera. But we like the way the enclosure can be mounted in a permanent position and the camera can be removed for maintenance and placed back in the security enclosure without large translational or rotational shifts in the field of view. We have used other cameras and mounting systems where the camera and/or mount has to be loosened or removed when swapping the SD card and/or changing batteries. When we re-attach the camera and/or mount, it’s a guessing game as to whether we’ve returned the camera to a position that captures even a similar field of view.
Other Accessories:
Things we think you should NOT do:
Pretty please, do not just stick a t-post in the ground and attach a camera. You will get a lot of camera movement and it will make life more difficult when you want to process your images.
Do not just strap a camera on a tree. If you are using a tree and can’t use screws or lag bolts, then securely attach an enclosure (directly, or via swivel mount that is strapped to the tree). If you just strap the camera to a tree and then have to remove the strap and camera each time you swap an SD card and/or batteries, you will get a lot of camera movement and it will make life more difficult when you want to process your images.
In conclusion, we think the Reconyx camera is a good choice for our research projects. It is a relatively expensive option and much cheaper cameras might acquire imagery that is suitable for your work. We’d be happy to hear if there are other options that have worked well for you. When it’s all said and done, the best advice we can offer is to create a stable mounting system that minimizes changes in the field of view. Otherwise, you will get a lot of camera movement and it will make life more difficult when you want to process your images!
We have a new GRIME2 release. It is a bug-fix release that allows the program to run a little more quickly and use less disk space when the octagon target is used. We were creating unneeded debug information and images that have been removed.
Download and use the following installer to replace the previous software:
https://github.com/gaugecam-dev/GRIME2/releases/tag/v0.3.0.4-beta
https://github.com/gaugecam-dev/GRIME2/releases/tag/v0.3.0.5-beta
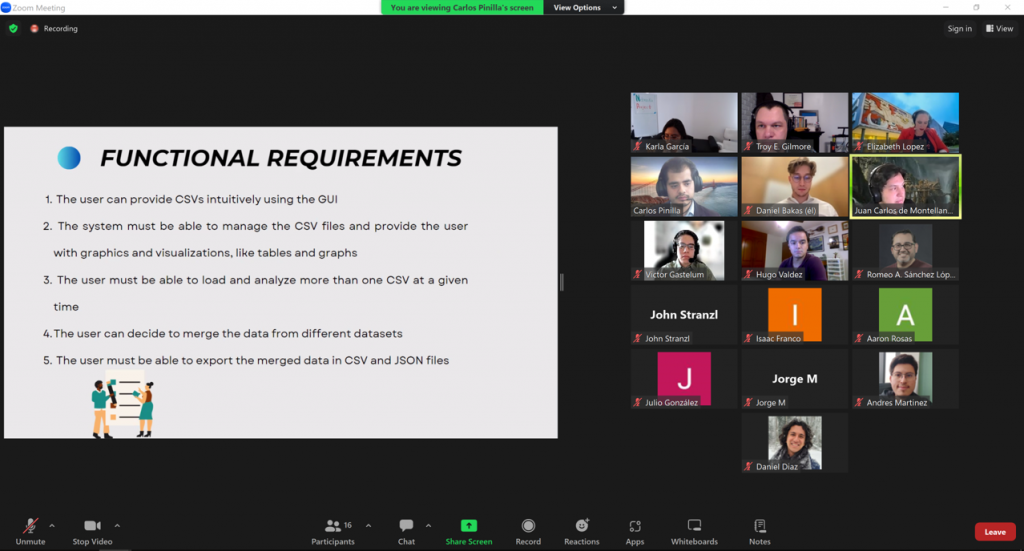
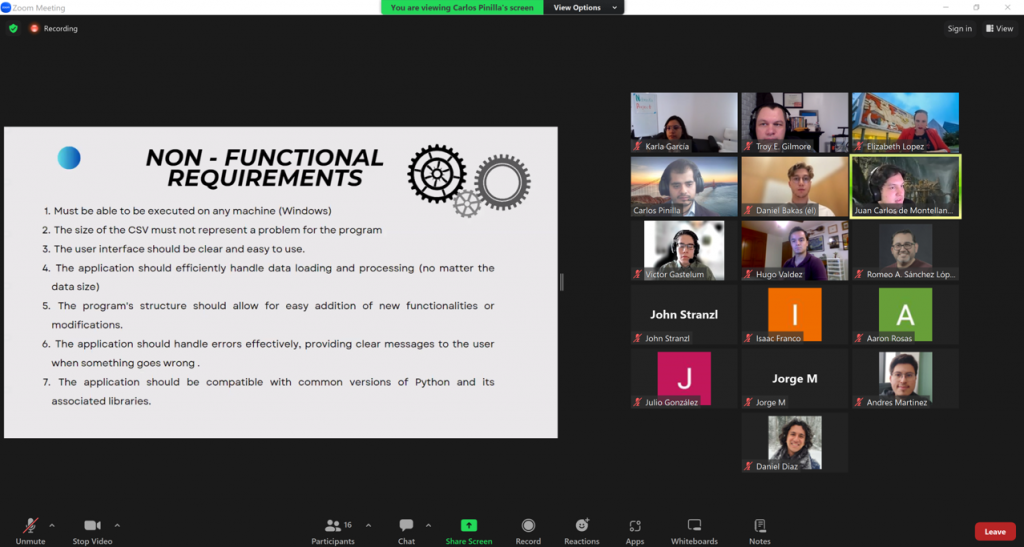
Building on the successful WaterFront Software and KOLA Data Portal projects, we embarked on another student-led adventure in the Fall 2023 semester! Professor Elizabeth López Ramos connected the GRIME Lab team with an excellent student team at Tecnológico de Monterrey (ITESM). These students led the Data Fusion Project.
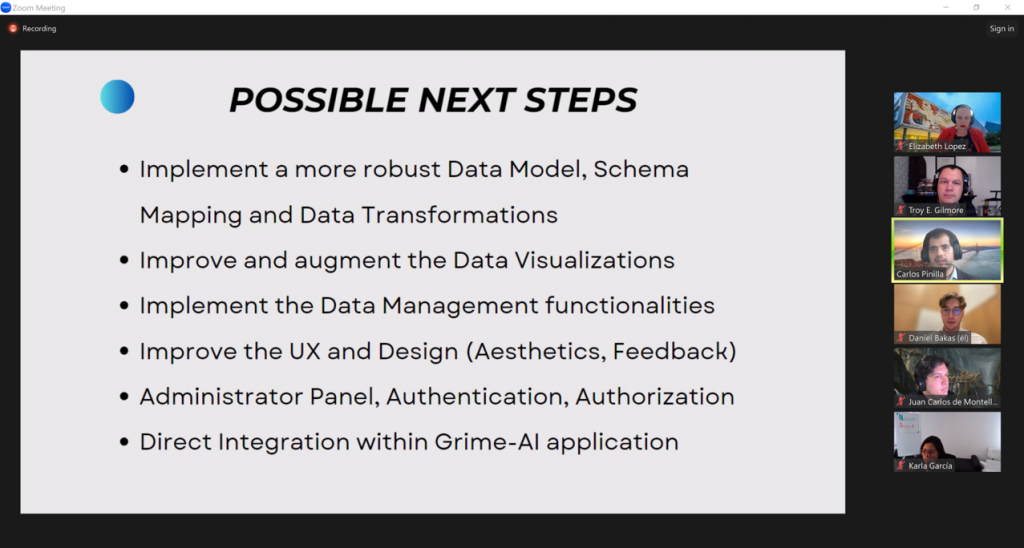
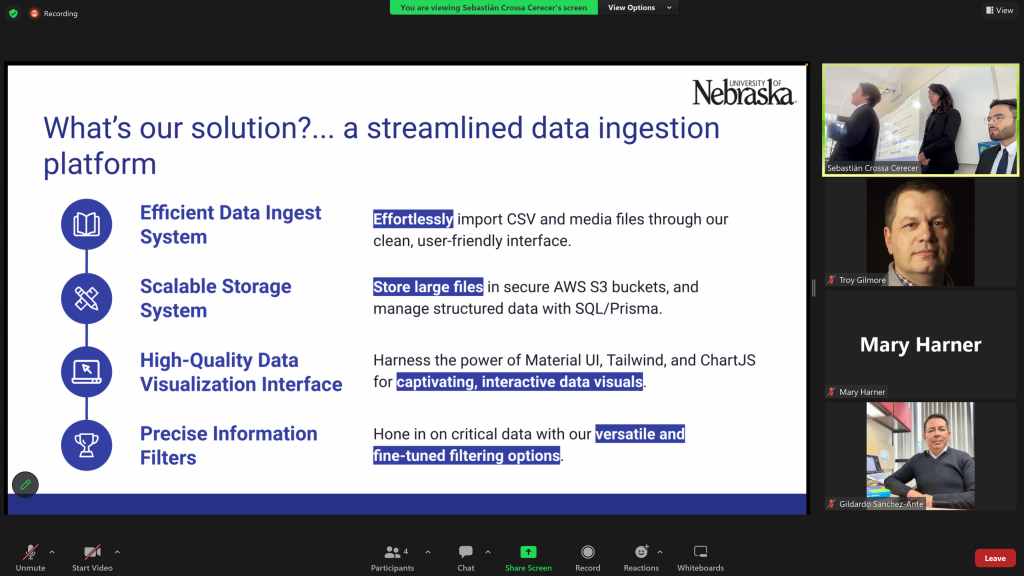
The Data Fusion Project is a first step toward integrating data fusion features in the GRIME-AI user interface. And the ITESM team dived DEEP into the software development life cycle on this one! As “clients” the GRIME Lab team had multiple meetings and filled out an extensive questionnaire. This made us really think through the requirements we desired. The ITESM team extensively documented this process, which is a major benefit to everyone going forward. Below are some screenshots from the ITESM team’s final presentation.
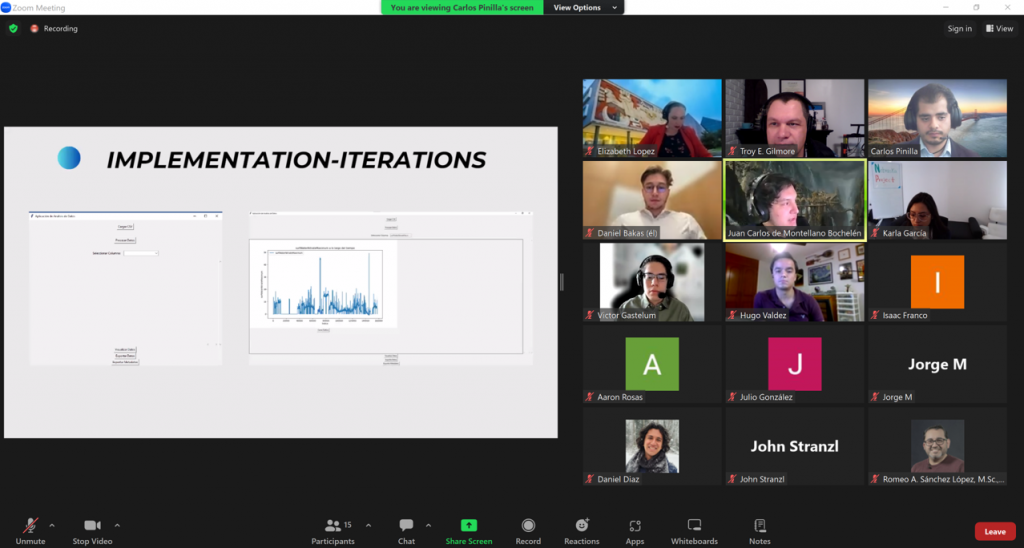
The ITESM did a great job of working across campuses and completing a lot of behind-the-scenes work required to finish this project. Their project can be found on GitHub.
Overall, we are grateful for the opportunity to work with the ITESM Team. They were very professional and worked hard to create a viable product!
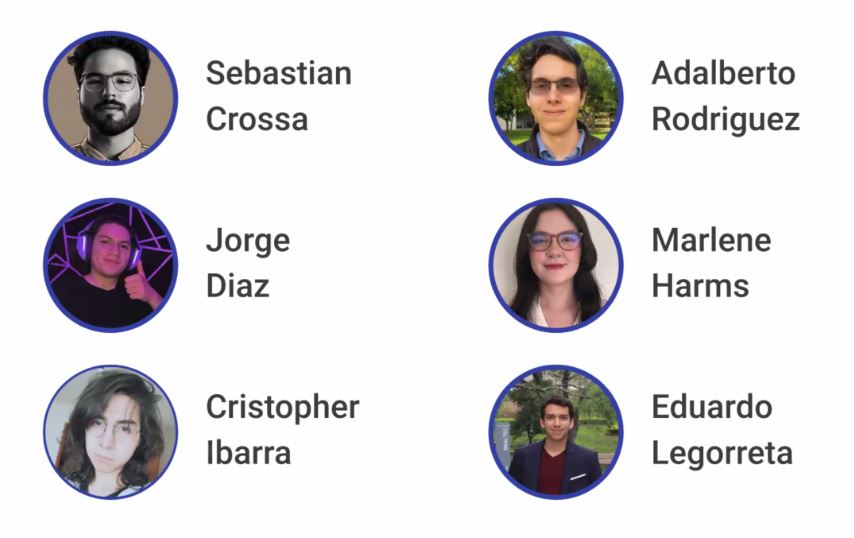
Many thanks to:
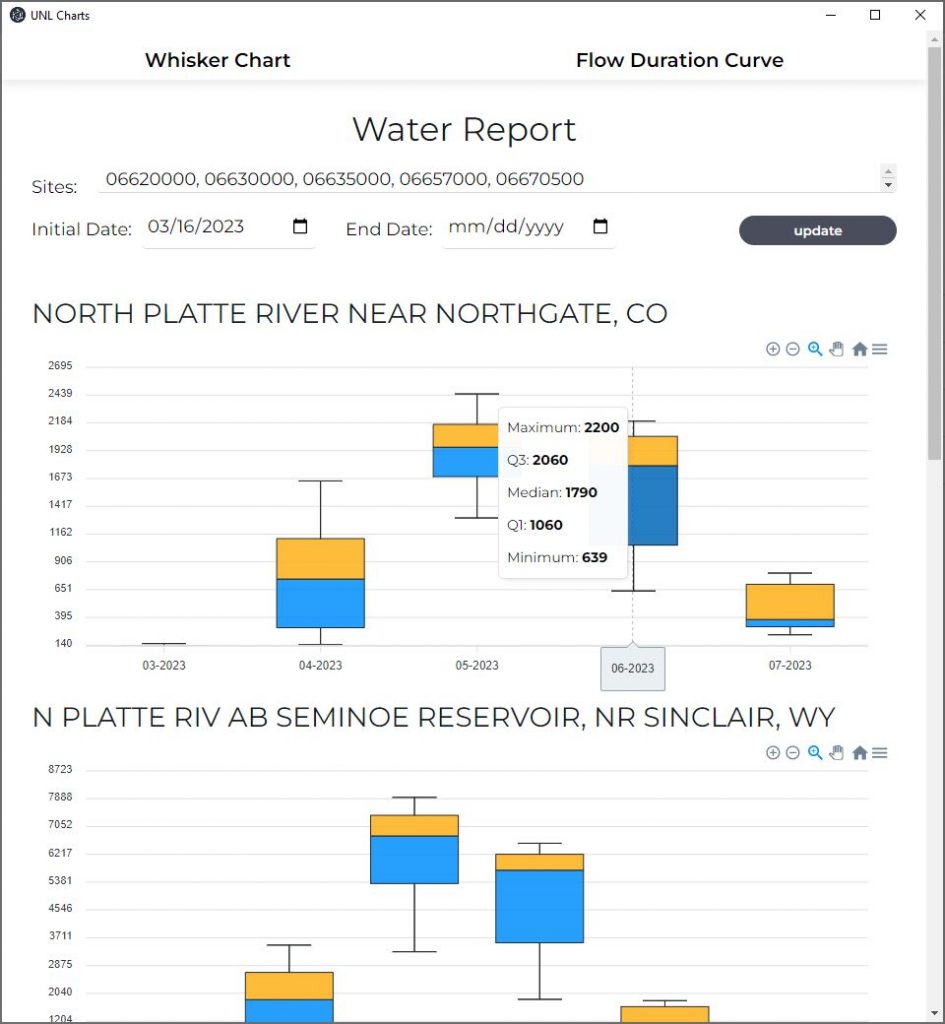
Hydrologists are used to jumping through hoops to access data. But it doesn’t have to be that way all the time! In a single semester, the stellar Tecnológico de Monterrey (ITESM) WaterFront Project Team developed software that will easily display monthly summaries of streamflow at multiple USGS stream gages. As a bonus, we can quickly view flow duration curves for the same gages.
Thanks to the ITESM team’s expertise and hard work, this software will be used to generate Extension hydrology reports for the Platte River in Nebraska. Platte River streamflows are critical for agricultural production and for important wildlife habitat in Nebraska.
The UNL GaugeCam Team, along with Doug Hallum at the West Central Research, Education and Extension Center, presented this challenge to the capstone student group in the Departamento de Computación and Escuela de Ingeniería y Ciencias. ITESM students, led by Professor Elizabeth López Ramos, tackled this project in two phases.
PHASE 1: Gather list of client requirements and develop proposal.
PHASE 2: Build out the software based on the accepted proposal.
Just like real world situations, we (UNL) came into this project with many ideas for the team. In other words, we gave them the very real challenge of (1) setting realistic expectations for the client, and (2) helping the client know what they actually want for a final product. And what we got was a streamlined, professional Windows application and good documentation.
Check out the animation below to see some of the WaterFront features.
We are truly grateful to the ITESM WaterFront Team for their dedication to this project.
Special thanks also to Professor Elizabeth López Ramos and Professor Gildardo Sánchez Ante for a wonderful experience working with your class. We hope we can continue working together!
In Spring 2023 the GaugeCam team at the University of Nebraska worked with two excellent student groups on their capstone projects in the Departamento de Computación and Escuela de Ingeniería y Ciencias at Tecnológico de Monterrey (ITESM).
The first group we are featuring is the KOLA Data Portal Team. These students did an amazing job creating a web interface for multimodal environmental data! Professor Elizabeth López Ramos was the instructor for this capstone course.
This project was focused on creating a data portal for the Kearney Outdoor Learning Area (KOLA) site that is located next to the Kearney, NE High School. The project was designed to simulate real interaction with clients and included two phases.
PHASE 1: Gather list of client requirements and develop proposal.
PHASE 2: Build out the data ingestion platform based on the accepted proposal.
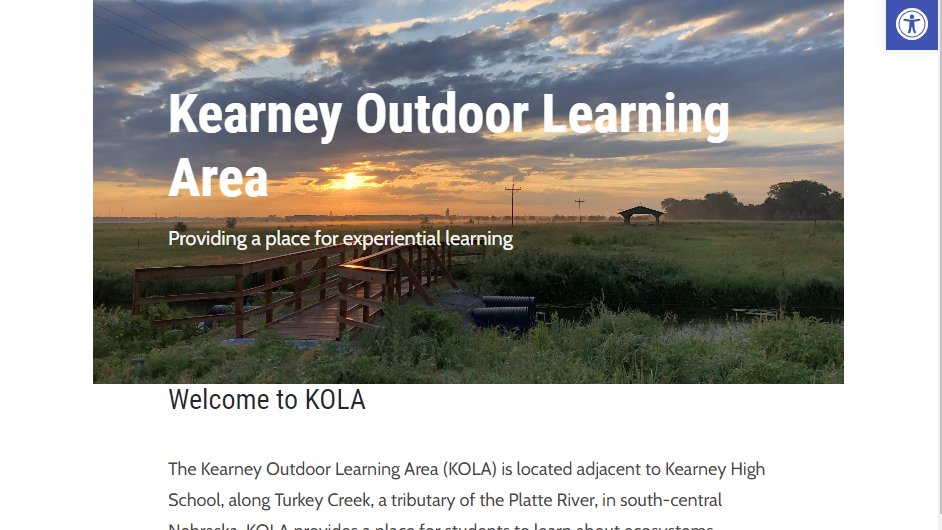
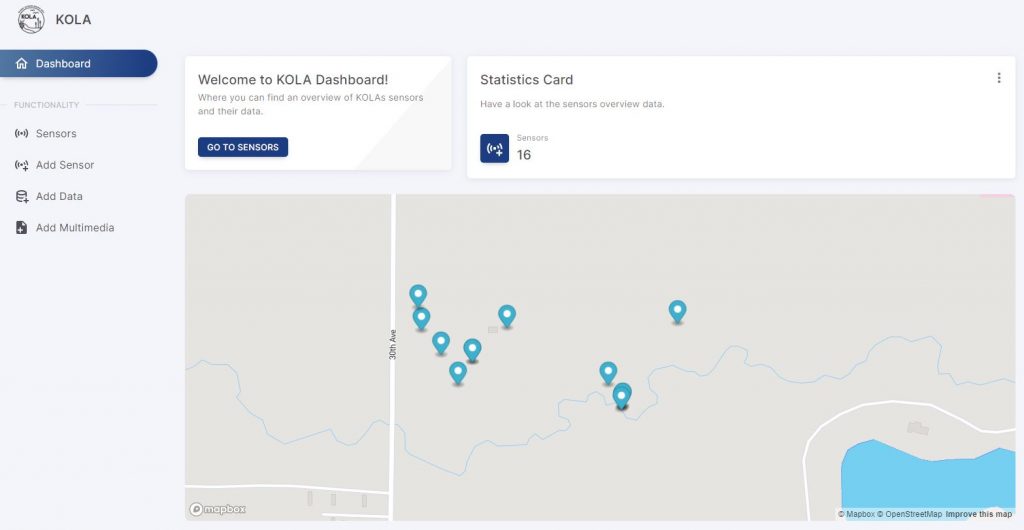
A view and description of KOLA can be seen in the screenshot below.
The key deliverables for the KOLA Portal project included the ability to upload and access several types of sensor data, including sound recordings, imagery, and scalar data (e.g., water levels). We met weekly with the KOLA Team. Students led those meetings, providing important updates and proposing next steps. As described in their final presentation, their solution consisted of the following:
The KOLA Portal has an attractive welcome screen, including a site map showing the various sensors that provide environmental data.
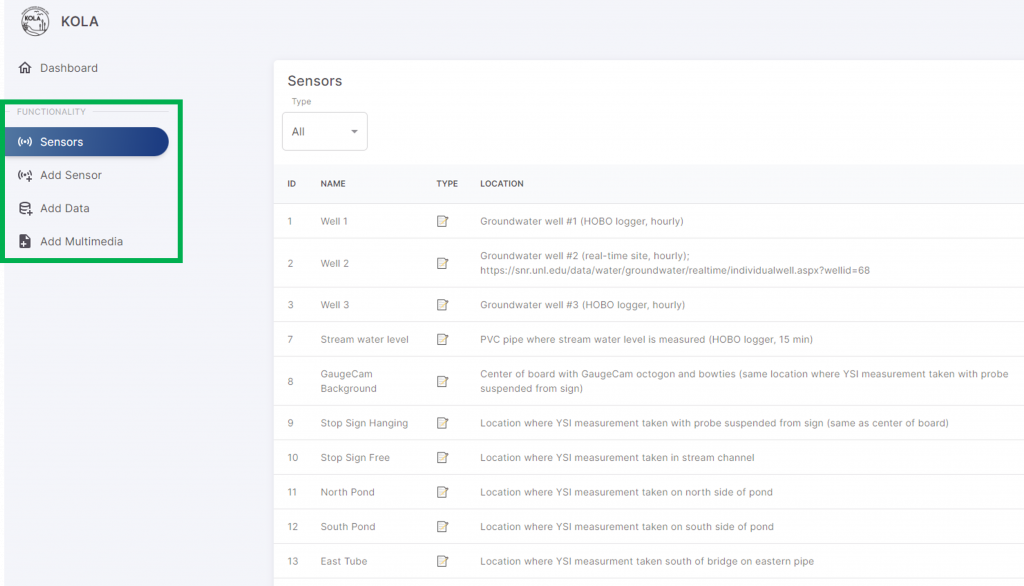
The green rectangle in the screenshot below highlights how we can now navigate from viewing the sensors, to adding a sensor, adding scalar data, and adding multimedia data on the platform.
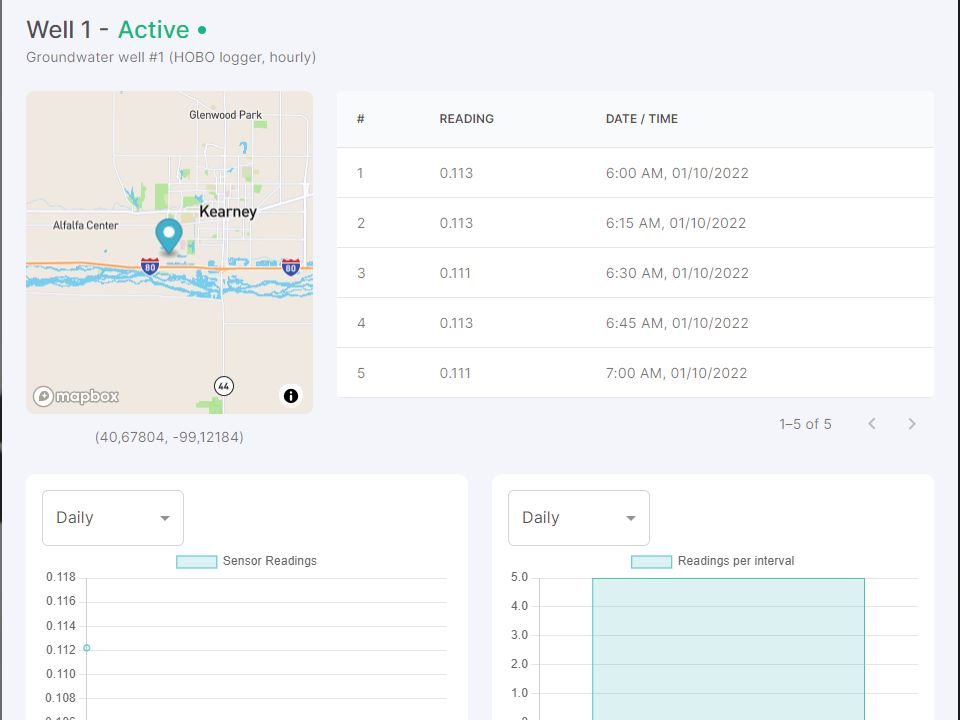
The portal also allows us to view sample data we provided the team, as shown below.
The KOLA Team also provided excellent documentation of the whole project! This was provided in a summary handoff email at the end of the semester. The video below shows the User Manual for the portal. The team also provided (1) an API reference and (2) a deployment guide that walks the user through the process of setting up the environment, navigating the codebase, and deploying the portal with the Next.js framework and Vercel hosting platform.
Overall, the KOLA Data Portal Team were highly productive and very professional. We are very grateful to Professor Elizabeth López Ramos and Professor Gildardo Sánchez Ante for involving us in the course. We learned a lot in the process and would love to work with other ITESM students in the future!
There are six key components to be concerned about when setting up the GaugeCam octagon calibration target in the field.
As you might guess, based on the bold text above, we are focusing on the last two items in this blog post, which are both related to the size of the octagon in images to achieve successful calibration for water level measurement.
To provide guidelines for the octagon dimensions (in pixels) required for successful calibration, we used imagery from the Kearney Outdoor Learning Area (KOLA). The image used was about 1MB when stored as a .jpg, as captured with a Reconyx trail camera.
In this simple test we resampled the images to reduce resolution. As the resolution was reduced, the size of the octagon was reduced. In other words, there were fewer pixels displayed across the width and facet lengths of the octagon. Similarly, the black border around the octagon became more pixelated.
The animation above shows when the octagon search algorithm began to break down as the resolution of the image is decreased. The decrease is represented by the scale annotation in the image. The scale value shown is the size of the image in percentage of the original image size (2304 x 1295 pixels, including the black strips at top and bottom of the image). Major failures of the octagon find and calibration started to occur at less than 60% of the original image resolution. The horizontal width of the blue area in the octagon target is 137 pixels in the 60% image.
Below is a table showing the desired width of the black border around the octagon. The suggested width for robust detection is 15 pixels, although the 60% image had a width of only about 11 pixels. The width of the black border can be measured in your images using the measurement tool in GRIME2.
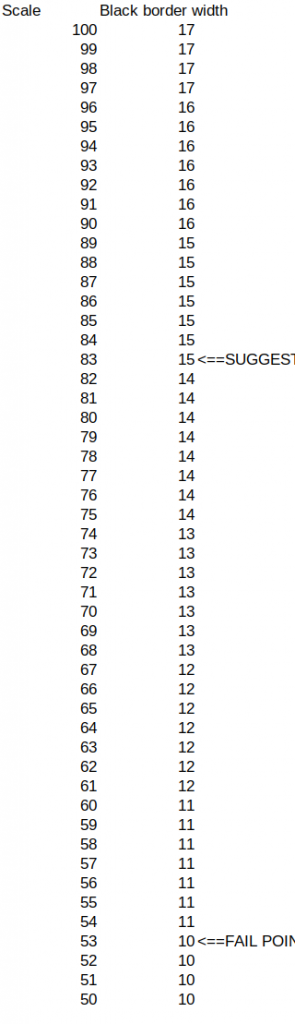
The major takeaway here is that, whatever the size of the images captured, the current GRIME2 octagon search and calibration algorithm should be robust for images where the blue part of the octagon is at least 137 pixels wide and the width of the black border is at very minimum 11 pixels wide but preferably at least 15 pixels wide. These values are based on a very simple test with an ideal image. Greater sizes (in pixels) of the octagon target are generally going to be preferable, and the overall performance of the system is still highly dependent on image scene quality (fewer shadows, glare, etc.) and proper installation of the target background in the stream.
We had a great online and in-person audience for Ken Chapman’s dissertation defense on Thursday May 8, 2023. Ken gave an excellent overview of his dissertation, as shown below. He will graduate in December 2023.
Congratulations Dr. Chapman!
A pdf of Ken’s presentation is available here.
Ken’s three major dissertation projects have resulted in a robust, free open-source water level measurement software and scientific publications.
More information and the GRIME2 software can be found here.
Publications are as follows:
Chapman, K. W., Gilmore, T. E., Chapman, C. D., Birgand, F., Mittlestet, A. R., Harner, M. J., et al. (2022). Technical Note: Open-Source Software for Water-Level Measurement in Images With a Calibration Target. Water Resources Research, 58(8), e2022WR033203. https://doi.org/10.1029/2022WR033203
Chapman, K., Gilmore, T., Mehrubeoglu, M., Chapman C., Mittelstet, A., Stranzl, J.E. (2023). Is there sufficient information in images to fill large data gaps of stage and discharge measurements with machine learning? PLOS Water [revised, in review]
Chapman, K. W., Gilmore, T. E., Harner, M. J., Stranzl, J.E., Chapman, C. D., Birgand, F., Mittlestet, A. R., et al. (2023). Technical Note: Improved Calibration Target for Open-Source, Image-Based Water-Level Measurement. In prep for Water Resources Research.
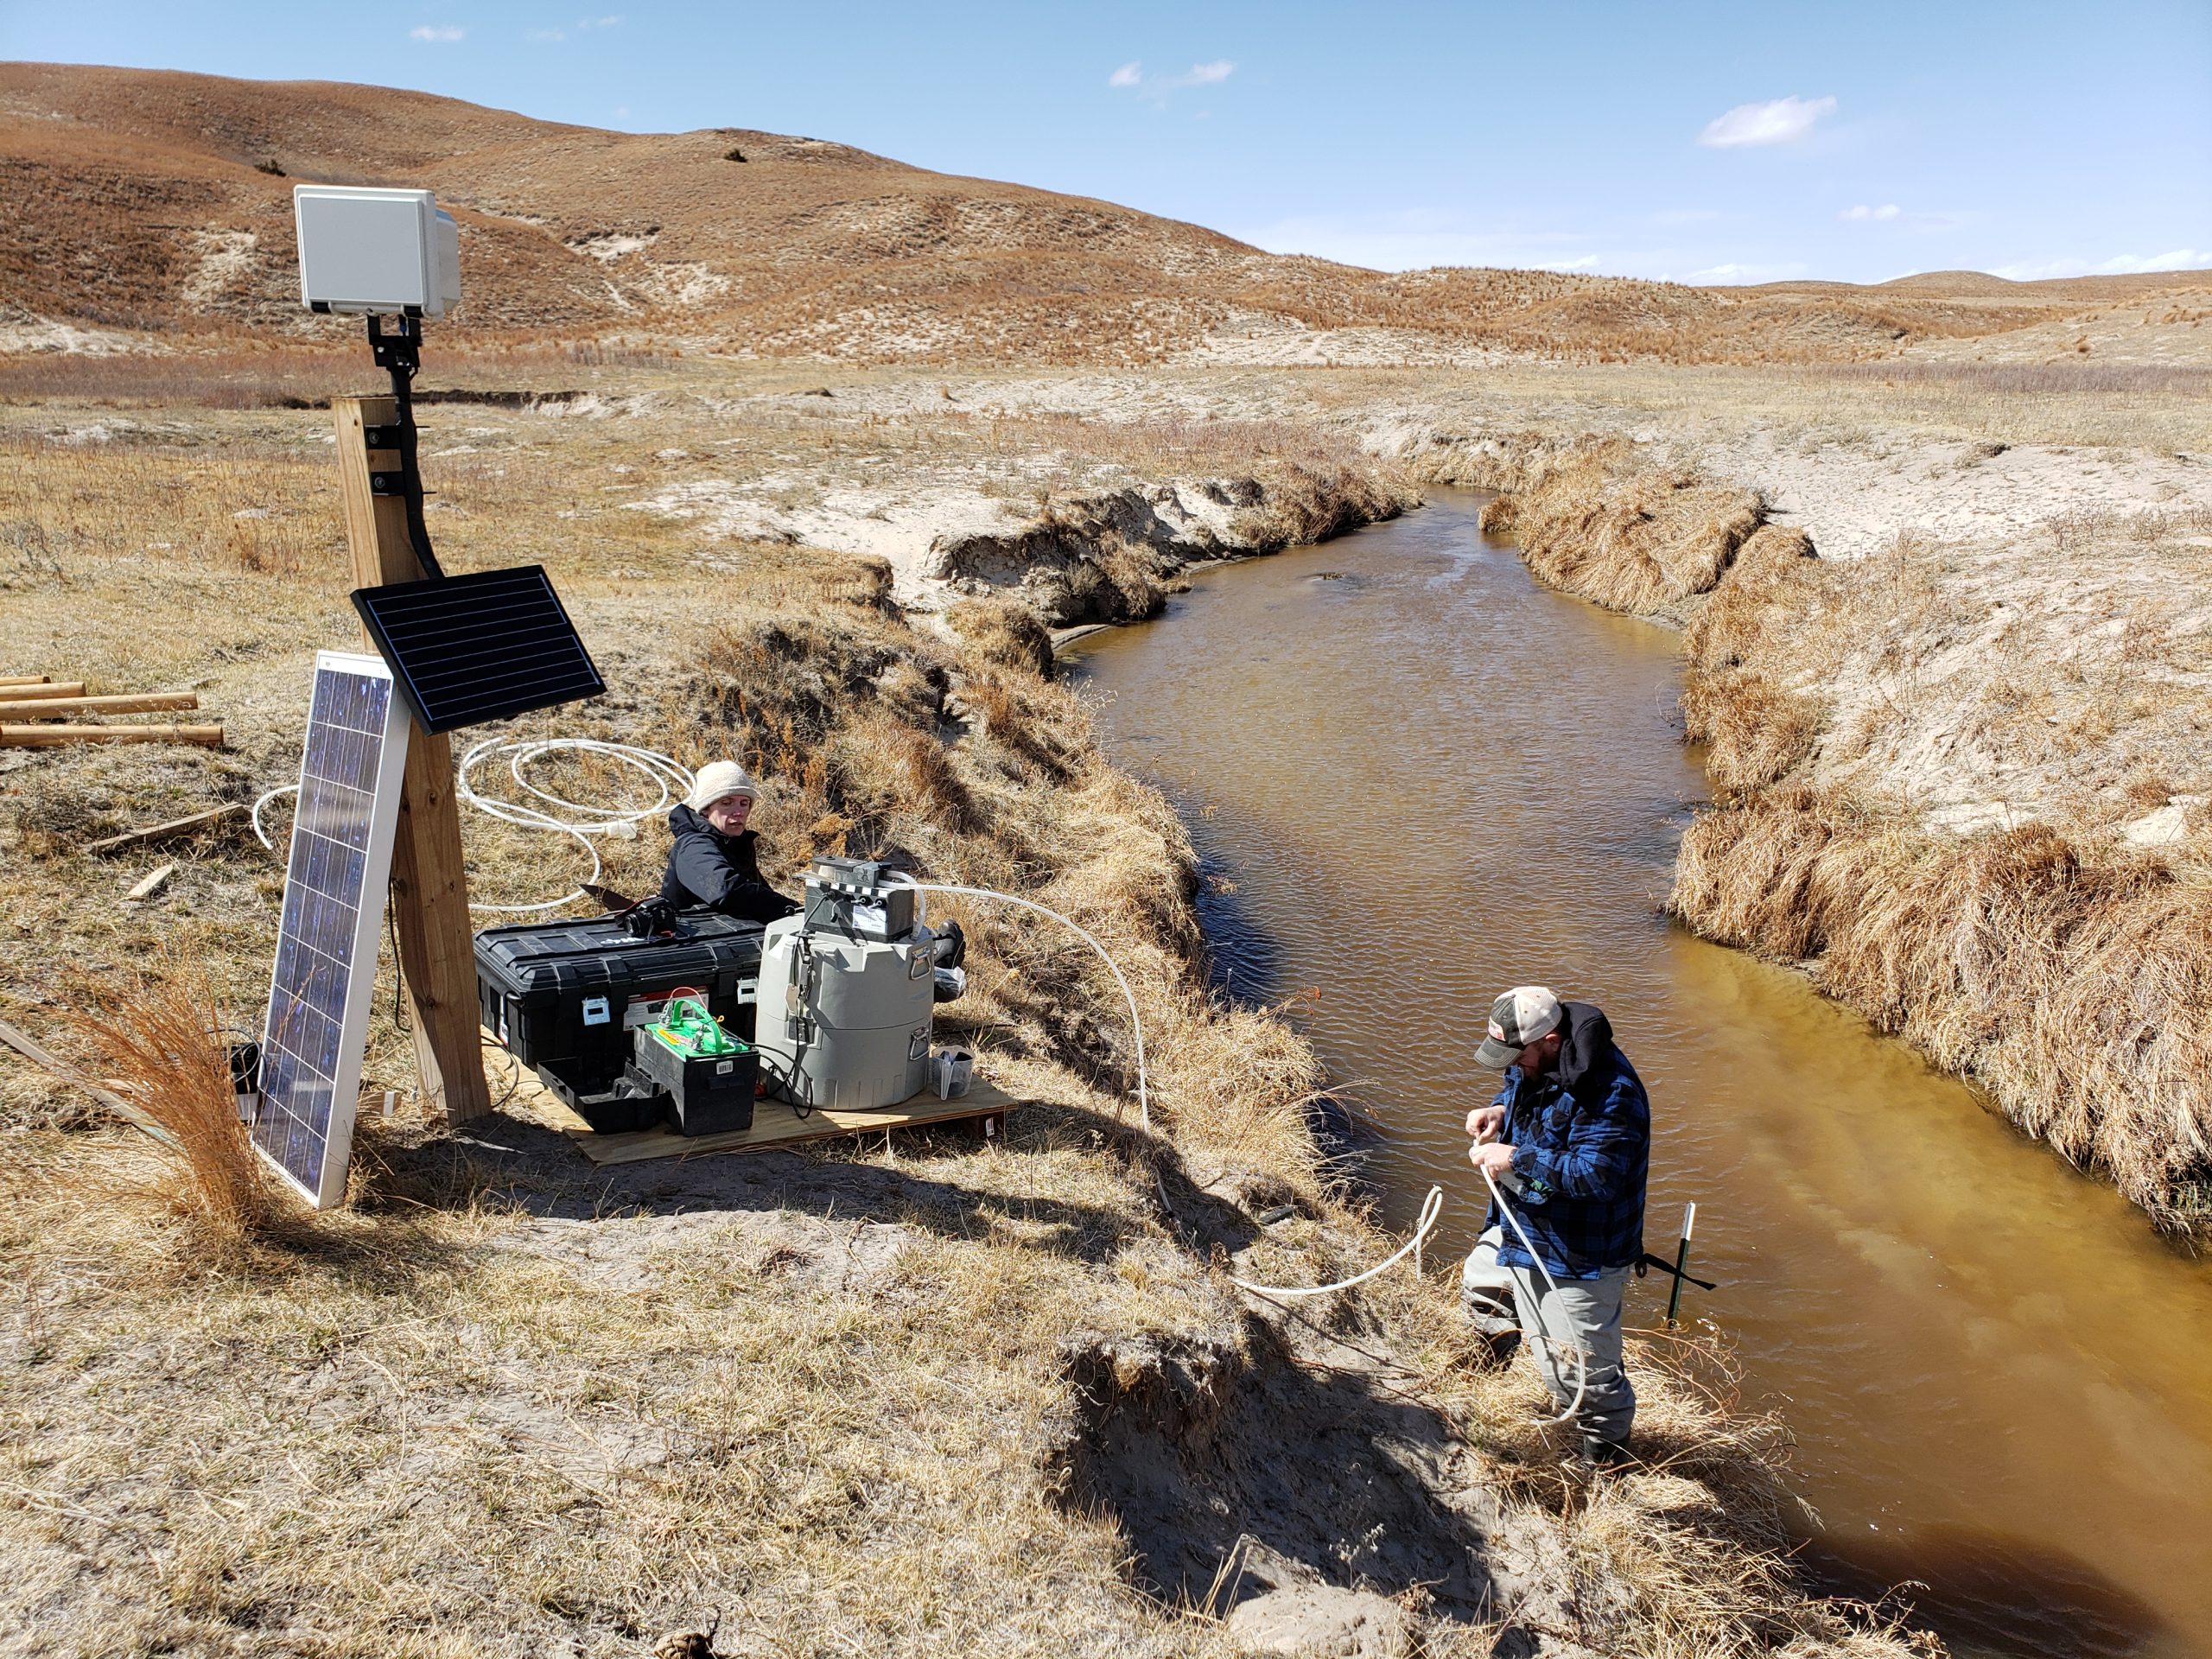
We monitored water quality in the Nebraska Sandhills, combining water sampling with time-lapse imagery from multiple cameras, including two co-located Platte Basin Timelapse cameras. The USGS 104b program supported this project. The animation below illustrates changing water color with changing dissolved organic carbon (DOC)* measured in water samples.
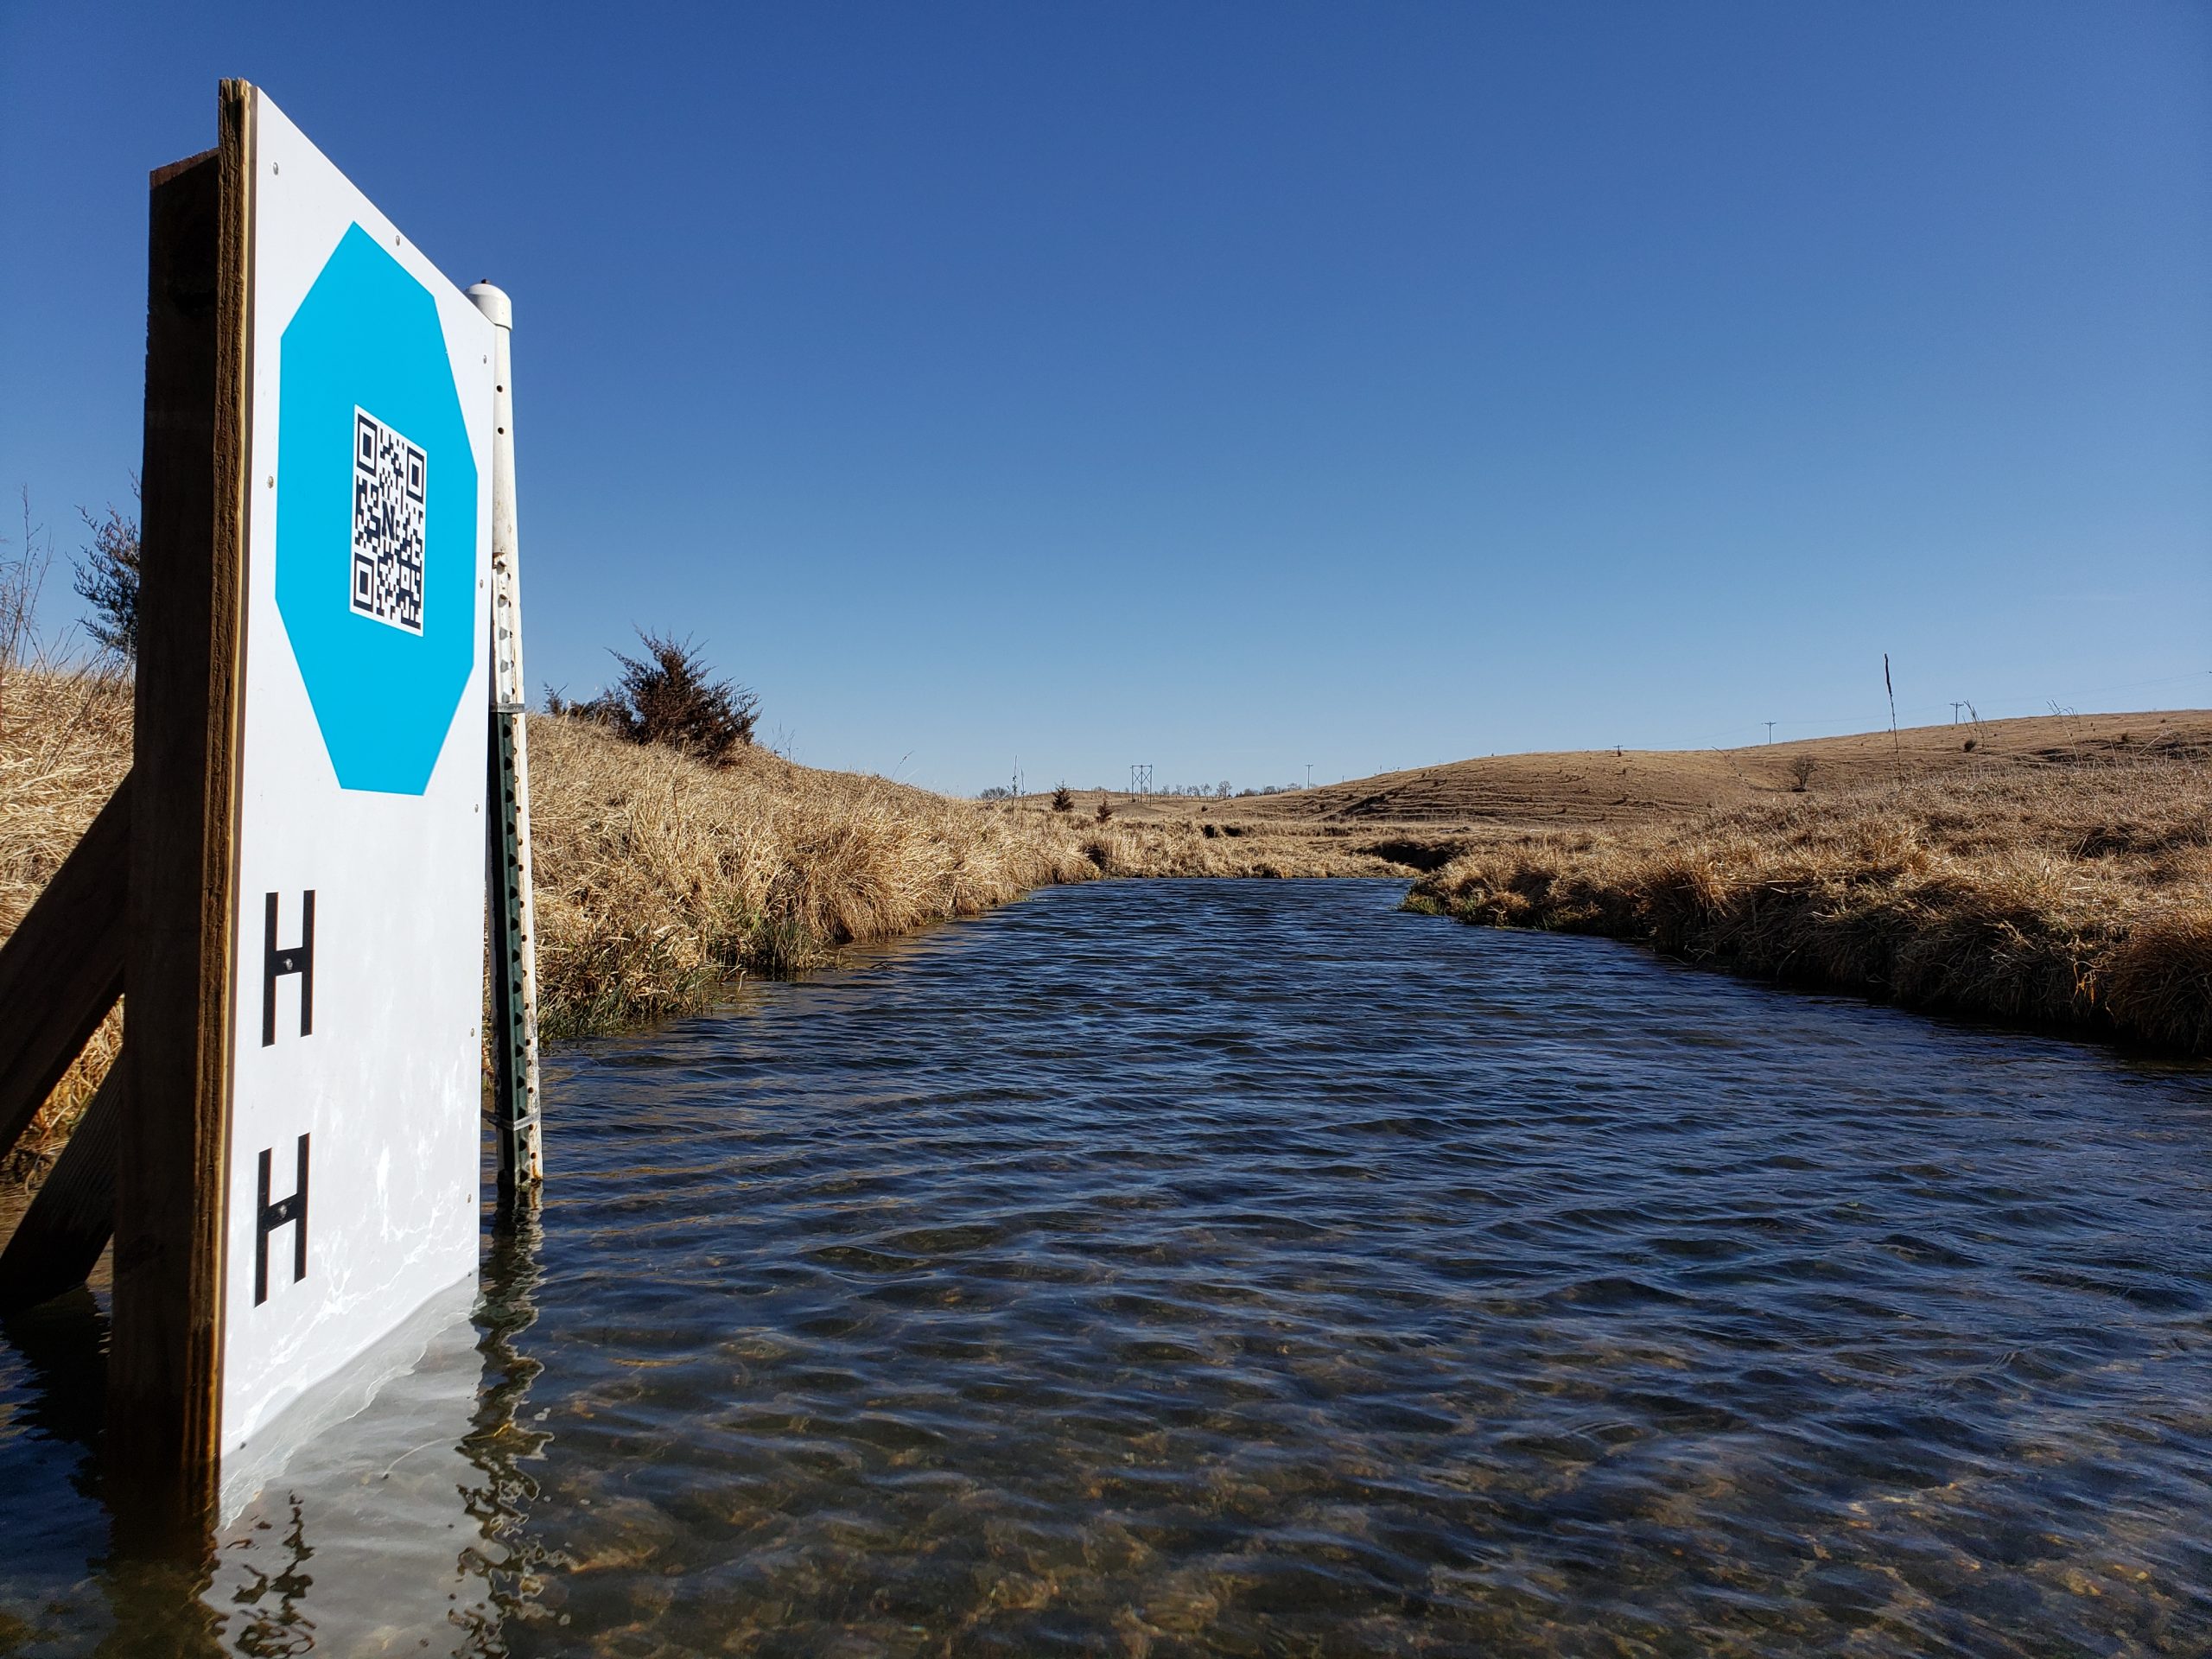
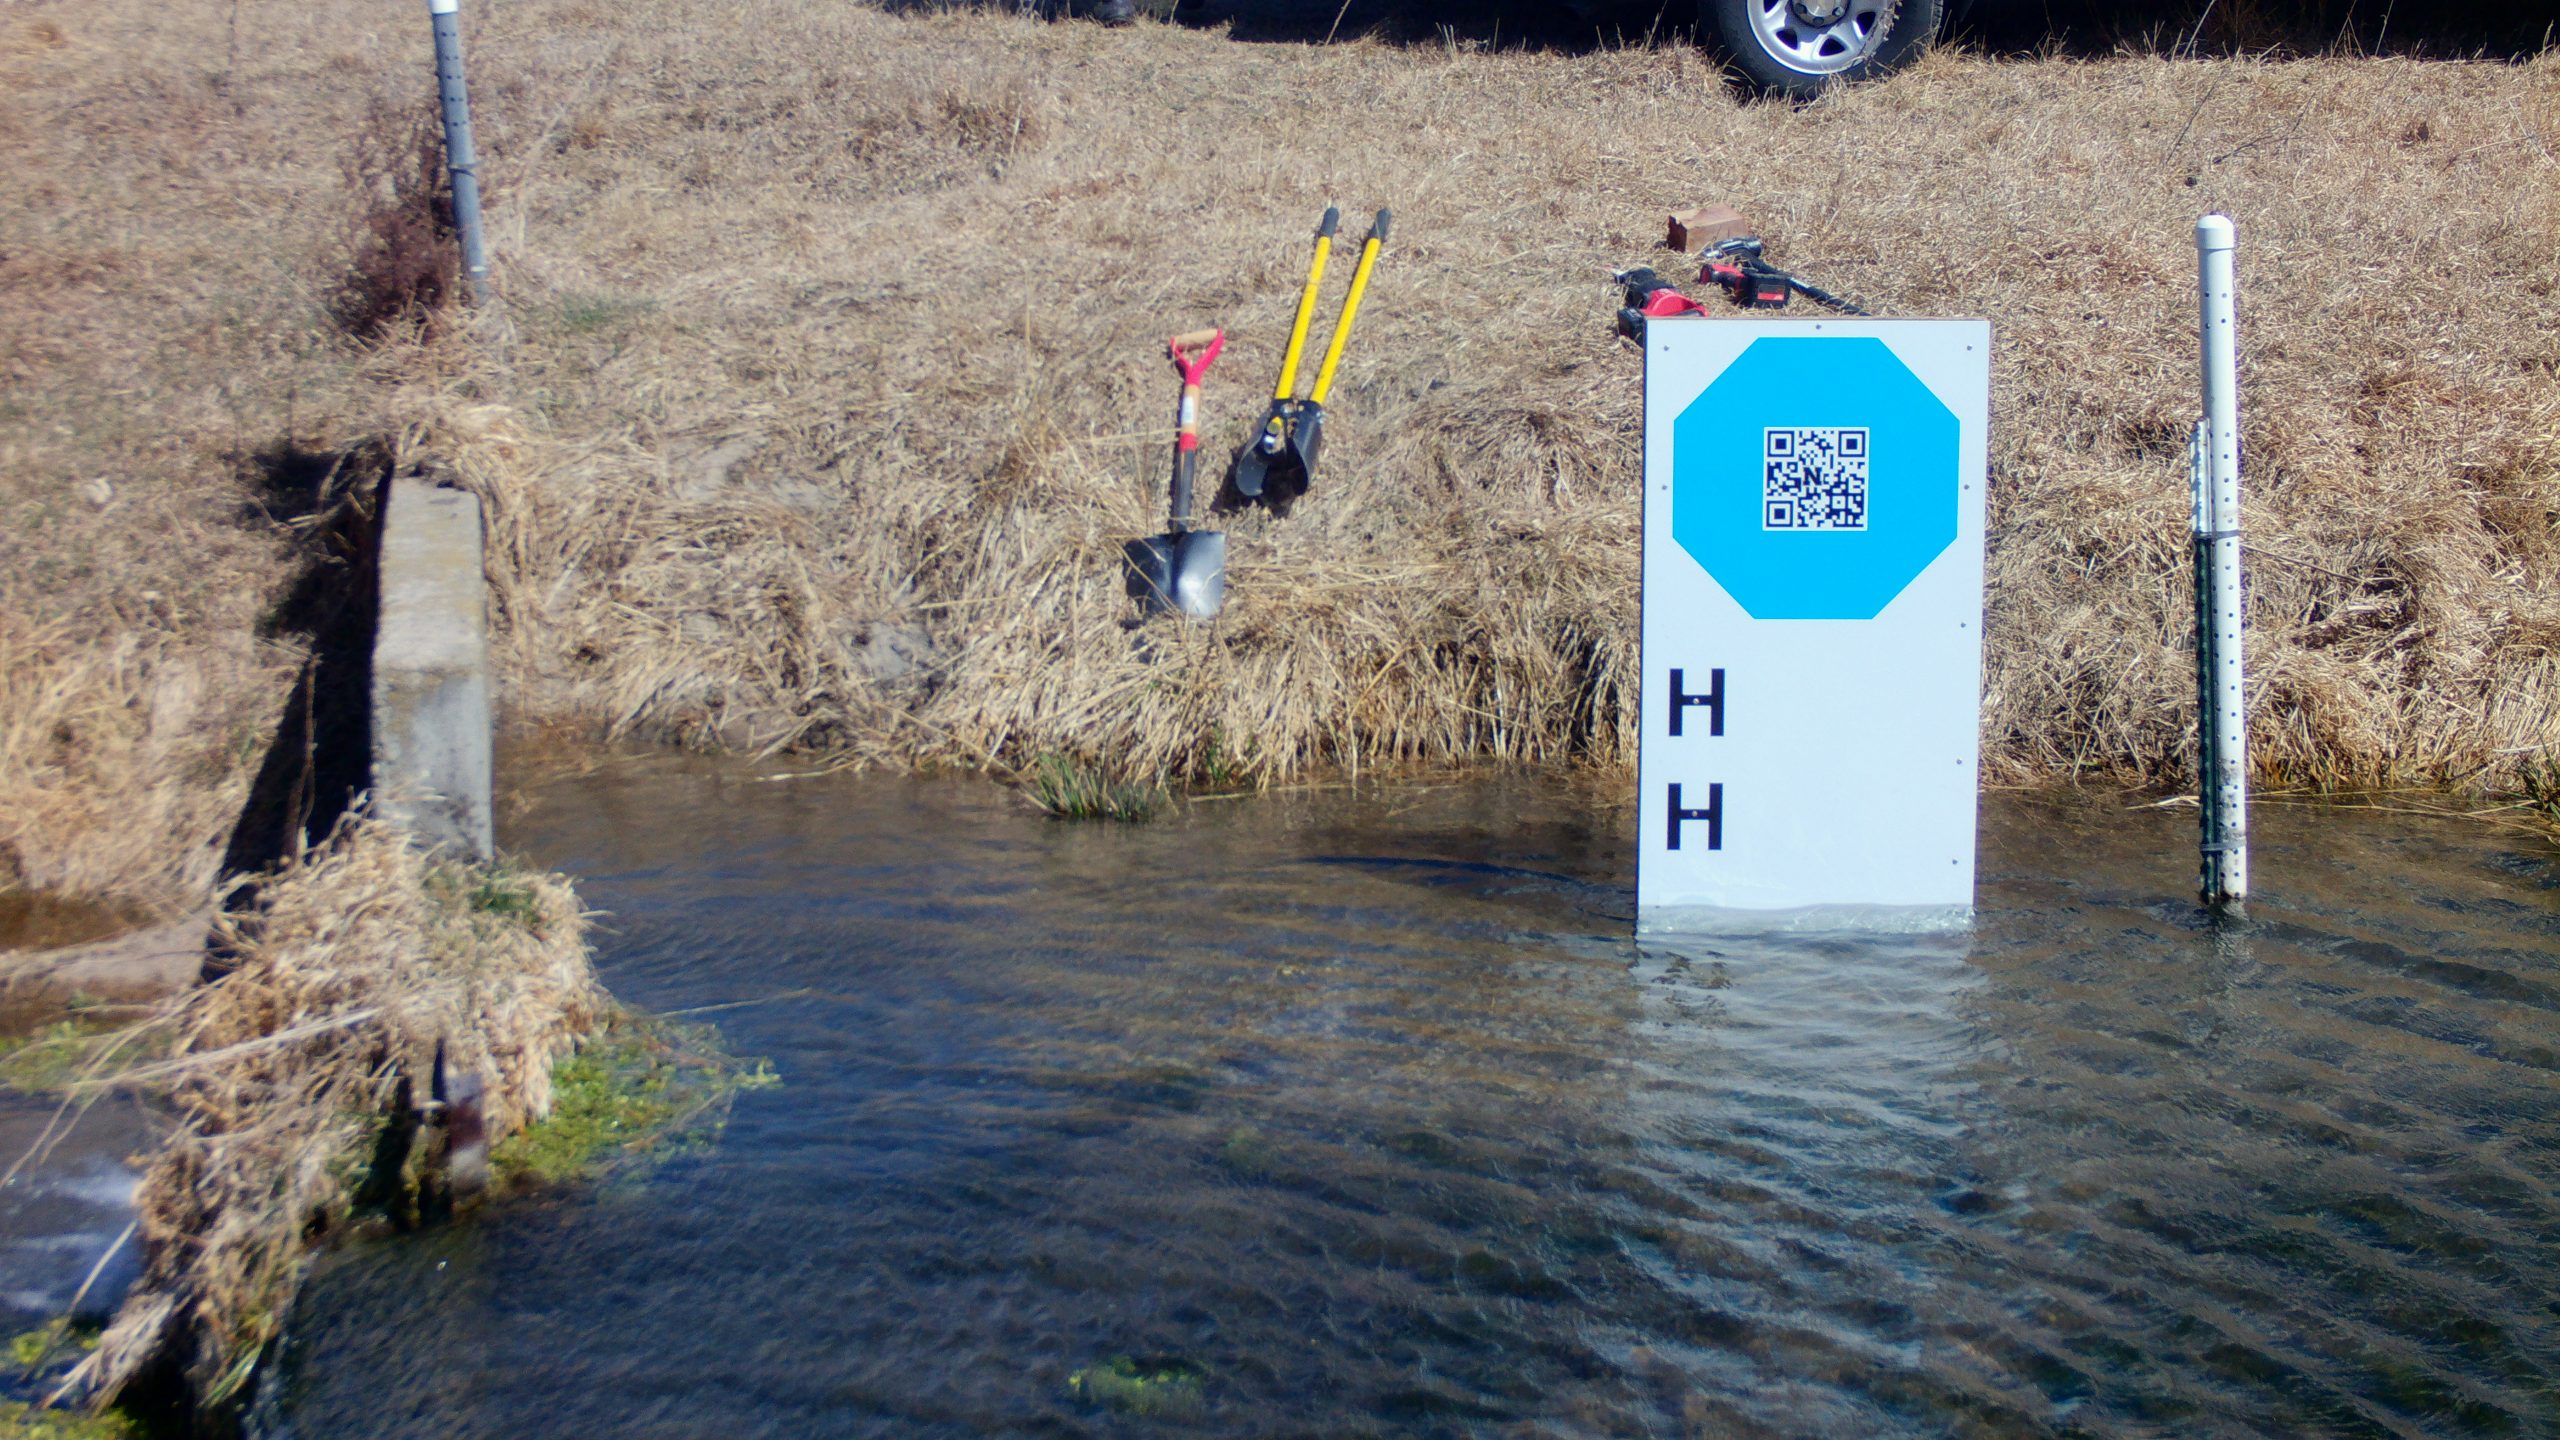
At the Kearney Outdoor Learning Area (KOLA), we installed two different GaugeCam targets as we develop less intrusive methods for image-based water level measurement. This installation, which also includes a traditional water level sensor (HOBO transducer), is the focus of PhD candidate Ken Chapman’s final dissertation chapter. This work is supported in part by the UNL Collaboration Initiative.
In Bazile Creek, we monitored water levels using a camera and GRIME2 software. This work is partially supported by USDA (PR-HPA LTAR Network).

GRIME2 (water level) software was published in a peer-reviewed article.
GRIME2 has now been updated to accommodate both a bowtie target (see right-hand side of KOLA image, above) and an octagon calibration target (left-hand side of KOLA image).
T.E. Gilmore, Stranzl, J., Chapman, K., Harner, M. GRIME-AI Open-Source Ecosystem for Time-lapse Imagery. USGS CDI Script-a-thon, October 11, 2022 (virtual, 50+ attendees)
Stranzl, J., T.E. Gilmore, M. Harner, and K. Chapman. 2022. GRIME-AI software for incorporating information from ground-based camera imagery with other sensor data (talk). Joint Aquatic Sciences Meeting, Grand Rapids, Michigan. May 2022.
Harner, M., T. Gilmore, K. Chapman, J. Bajelan, A. Klein, and C. Wagner. An introduction to the Kearney Outdoor Learning Area (KOLA) for experiential learning in ecohydrological research. 2022 Platte River Basin Conference. Kearney, NE. October 2022.
The GaugeCam (GRIME Lab) team, including PI Troy Gilmore at University of Nebraska-Lincoln and Mary Harner at the University of Nebraska at Kearney, have been using imagery in eco-hydrologic studies and science communication for about a decade. The University of Nebraska is also home to a large time-lapse image archive from high-resolution (DSLR) cameras deployed across the Platte River Basin. Since 2010, the Platte Basin Timelapse project has acquired and archived over 3 million high quality images of water features across the watershed. These images are captured hourly during daylight hours and contain large amounts of untapped scientific information. Our team is devoted to (1) extracting ecological and hydrological information from imagery, and (2) building software that makes these tasks easy for other scientists.
Over the last 9 months, the GaugeCam GRIME Lab has benefited greatly from a fast-developing collaboration with scientists at Tecnológico de Monterrey (ITESM). Our collaboration involves both teaching and research.
Teaching
Dr. Gildardo Sánchez Ante, Professor in the Department of Computation in the School of Engineering and Sciences at the Guadalajara Campus has incorporated image-based hydrology projects in two courses. The GaugeCam team has been joining these classes via Zoom. We have had the opportunity to introduce the students to the dataset and hydrology concepts. We have also heard updates from the student project teams and are looking forward to final project presentations this week. The students are doing a fantastic job of extracting information from imagery and building machine learning models that successfully predict streamflow in the North Platte River in Nebraska!
The two courses where Platte Basin Timelapse-derived data are being used are:
Research
We see many exciting opportunities for image-based water monitoring, including in Mexico. Based on our background with image-based hydrology projects and our collaboration with Dr. Sánchez Ante, we are also working closely with Dr. Pabel Antonio Cervantes Avilés to set up and pilot camera-based monitoring at a site on the Atoyac River (see video below for background on this river). Dr. Cervantes Avilés is in the Water Science and Technology Group, in the School of Engineering and Sciences at the Puebla Campus.
We are excited to have partners at ITESM with much-needed expertise in artificial intelligence and water quality. We look forward to new insights into water quality and camera-based monitoring approaches in 2023 and beyond.