Hydrologists are used to jumping through hoops to access data. But it doesn’t have to be that way all the time! In a single semester, the stellar Tecnológico de Monterrey (ITESM) WaterFront Project Team developed software that will easily display monthly summaries of streamflow at multiple USGS stream gages. As a bonus, we can quickly view flow duration curves for the same gages.
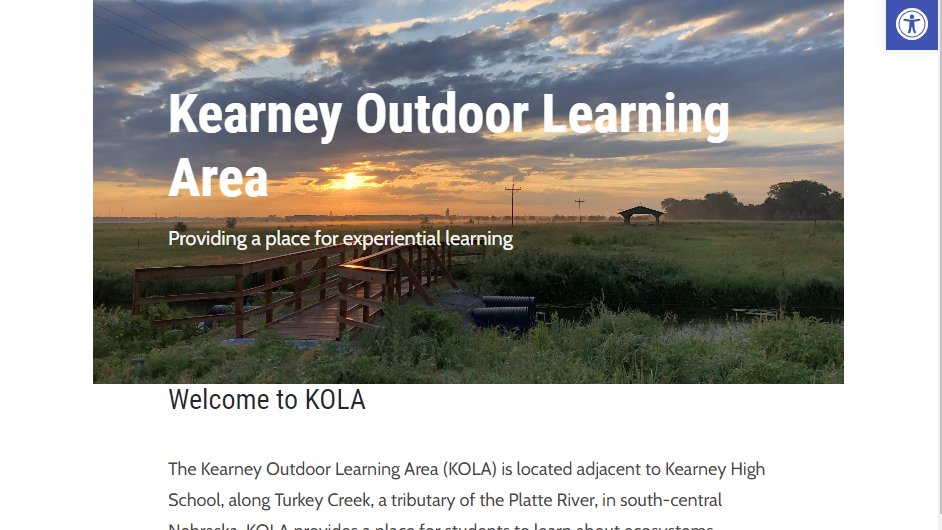
Thanks to the ITESM team’s expertise and hard work, this software will be used to generate Extension hydrology reports for the Platte River in Nebraska. Platte River streamflows are critical for agricultural production and for important wildlife habitat in Nebraska.
The UNL GaugeCam Team, along with Doug Hallum at the West Central Research, Education and Extension Center, presented this challenge to the capstone student group in the Departamento de Computación and Escuela de Ingeniería y Ciencias. ITESM students, led by Professor Elizabeth López Ramos, tackled this project in two phases.
PHASE 1: Gather list of client requirements and develop proposal.
- Requirement gathering and analysis based on meetings with client.
- Research and brainstorm to devise innovative and practical solutions.
- Create a concise proposal outlining solutions, timeline, budget, and benefits for the client.
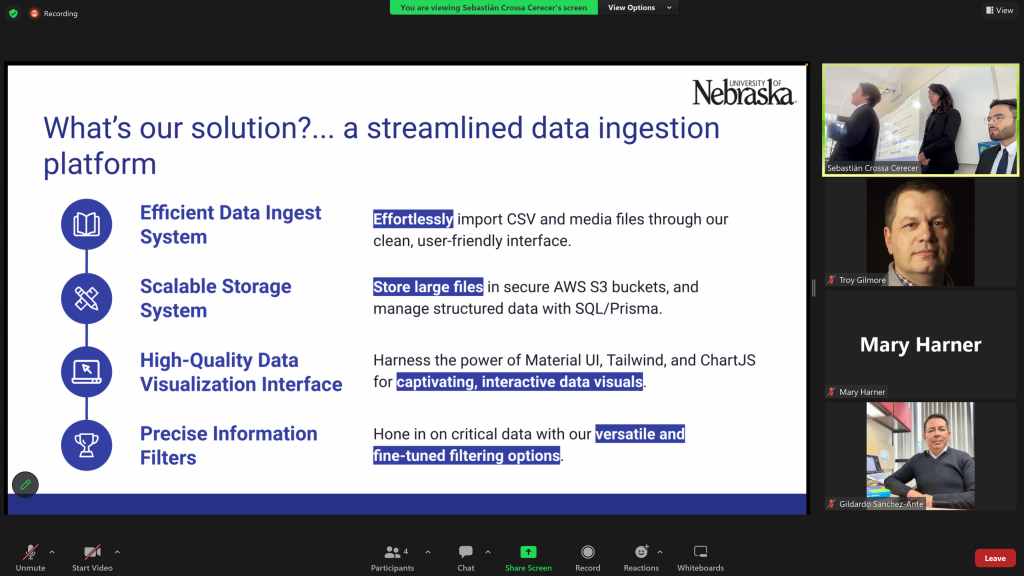
- Present refined proposal to the client, highlighting alignment with requirements and receiving feedback.
PHASE 2: Build out the software based on the accepted proposal.
- Construct platform, including features and functionality described in the proposal.
- Test software functionality, performance, and security to meet client requirements and industry standards.
- Present the software to the client for feedback and iterate to meet expectations and requirements.
- Deliver a functional Windows installer and documentation to the client.
Just like real world situations, we (UNL) came into this project with many ideas for the team. In other words, we gave them the very real challenge of (1) setting realistic expectations for the client, and (2) helping the client know what they actually want for a final product. And what we got was a streamlined, professional Windows application and good documentation.
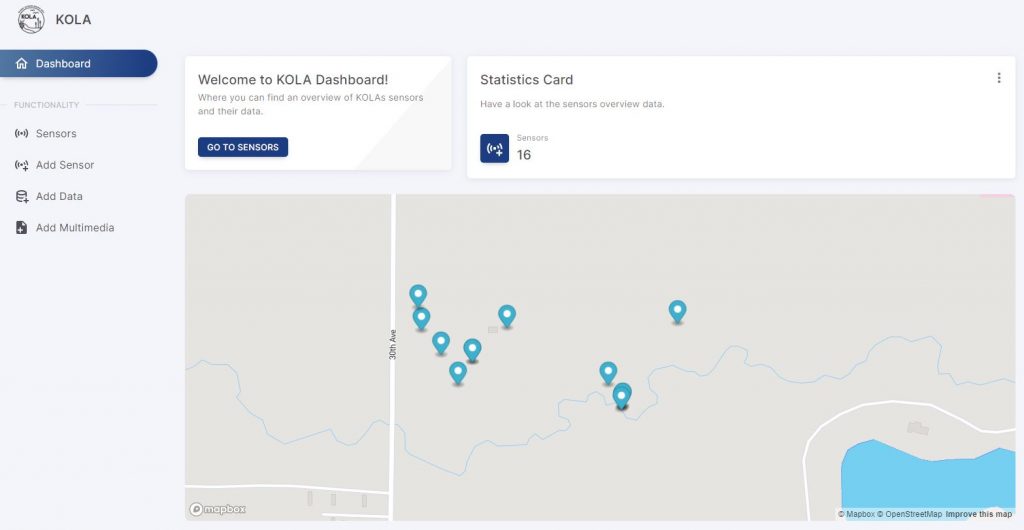
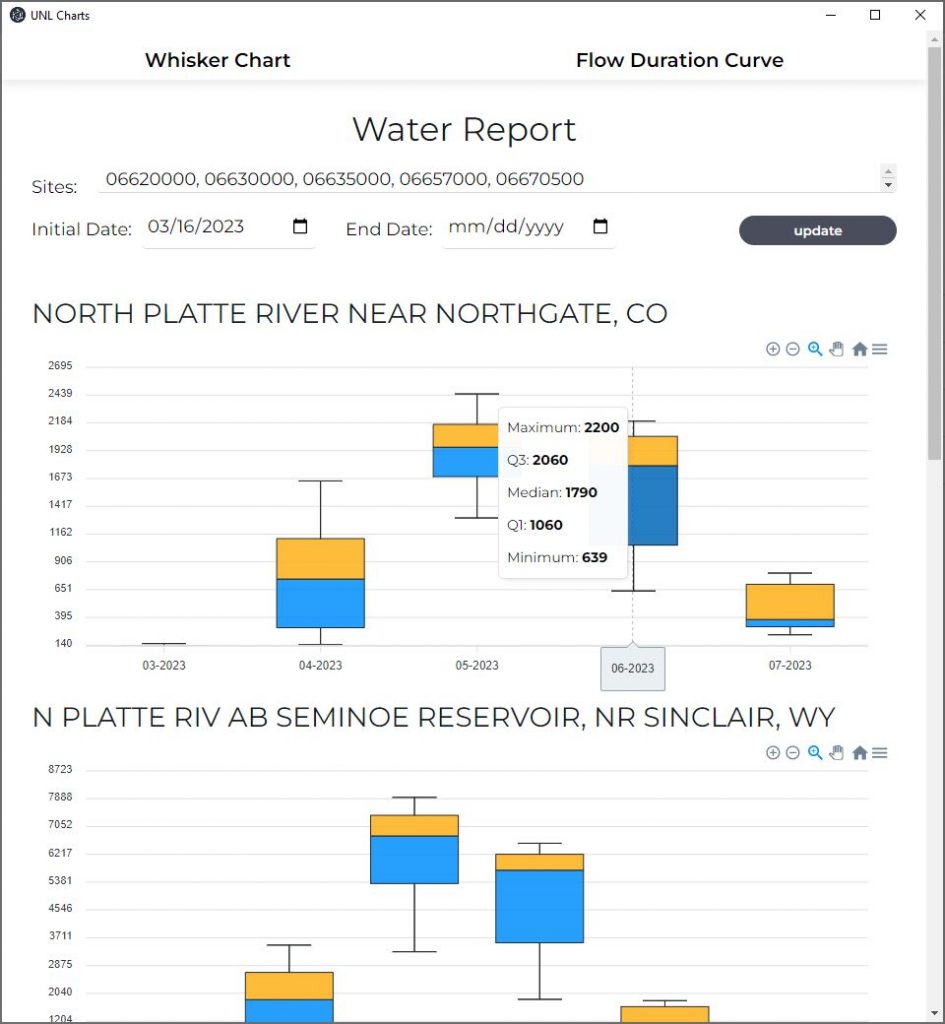
Check out the animation below to see some of the WaterFront features.
- Select a range of months to summarize
- Display monthly statistics by hovering mouse
- Display additional USGS gage sites
- Show flow-duration curves
- Download graphics and data
We are truly grateful to the ITESM WaterFront Team for their dedication to this project.
- Joel Fernando Santillán Santana
- Jorge Luis Salgado Ledezma
- Milton Eduardo Barroso Ramírez
- Miriam Paulina Palomera Curiel
- José Ricardo Vanegas Castillo
Special thanks also to Professor Elizabeth López Ramos and Professor Gildardo Sánchez Ante for a wonderful experience working with your class. We hope we can continue working together!