GaugeCam: development philosophy and trajectory of the GRIME software suite

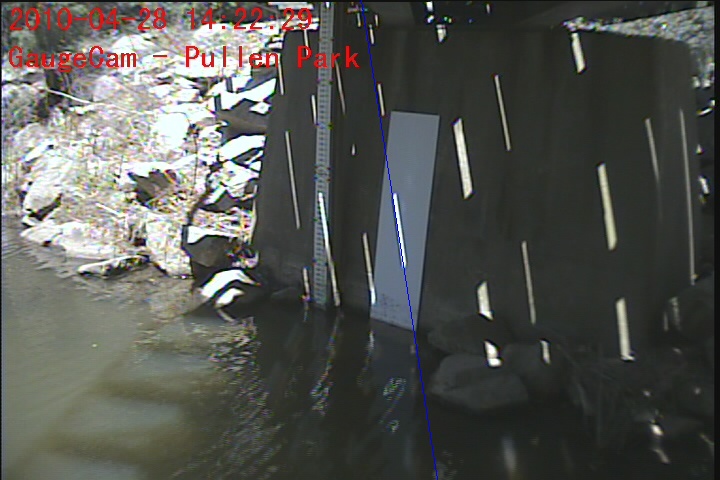
Since 2010, the GaugeCam team has been working on open-source software for ground-based time-lapse imagery (recently referred to by a colleague as “camera trap hydrology”).

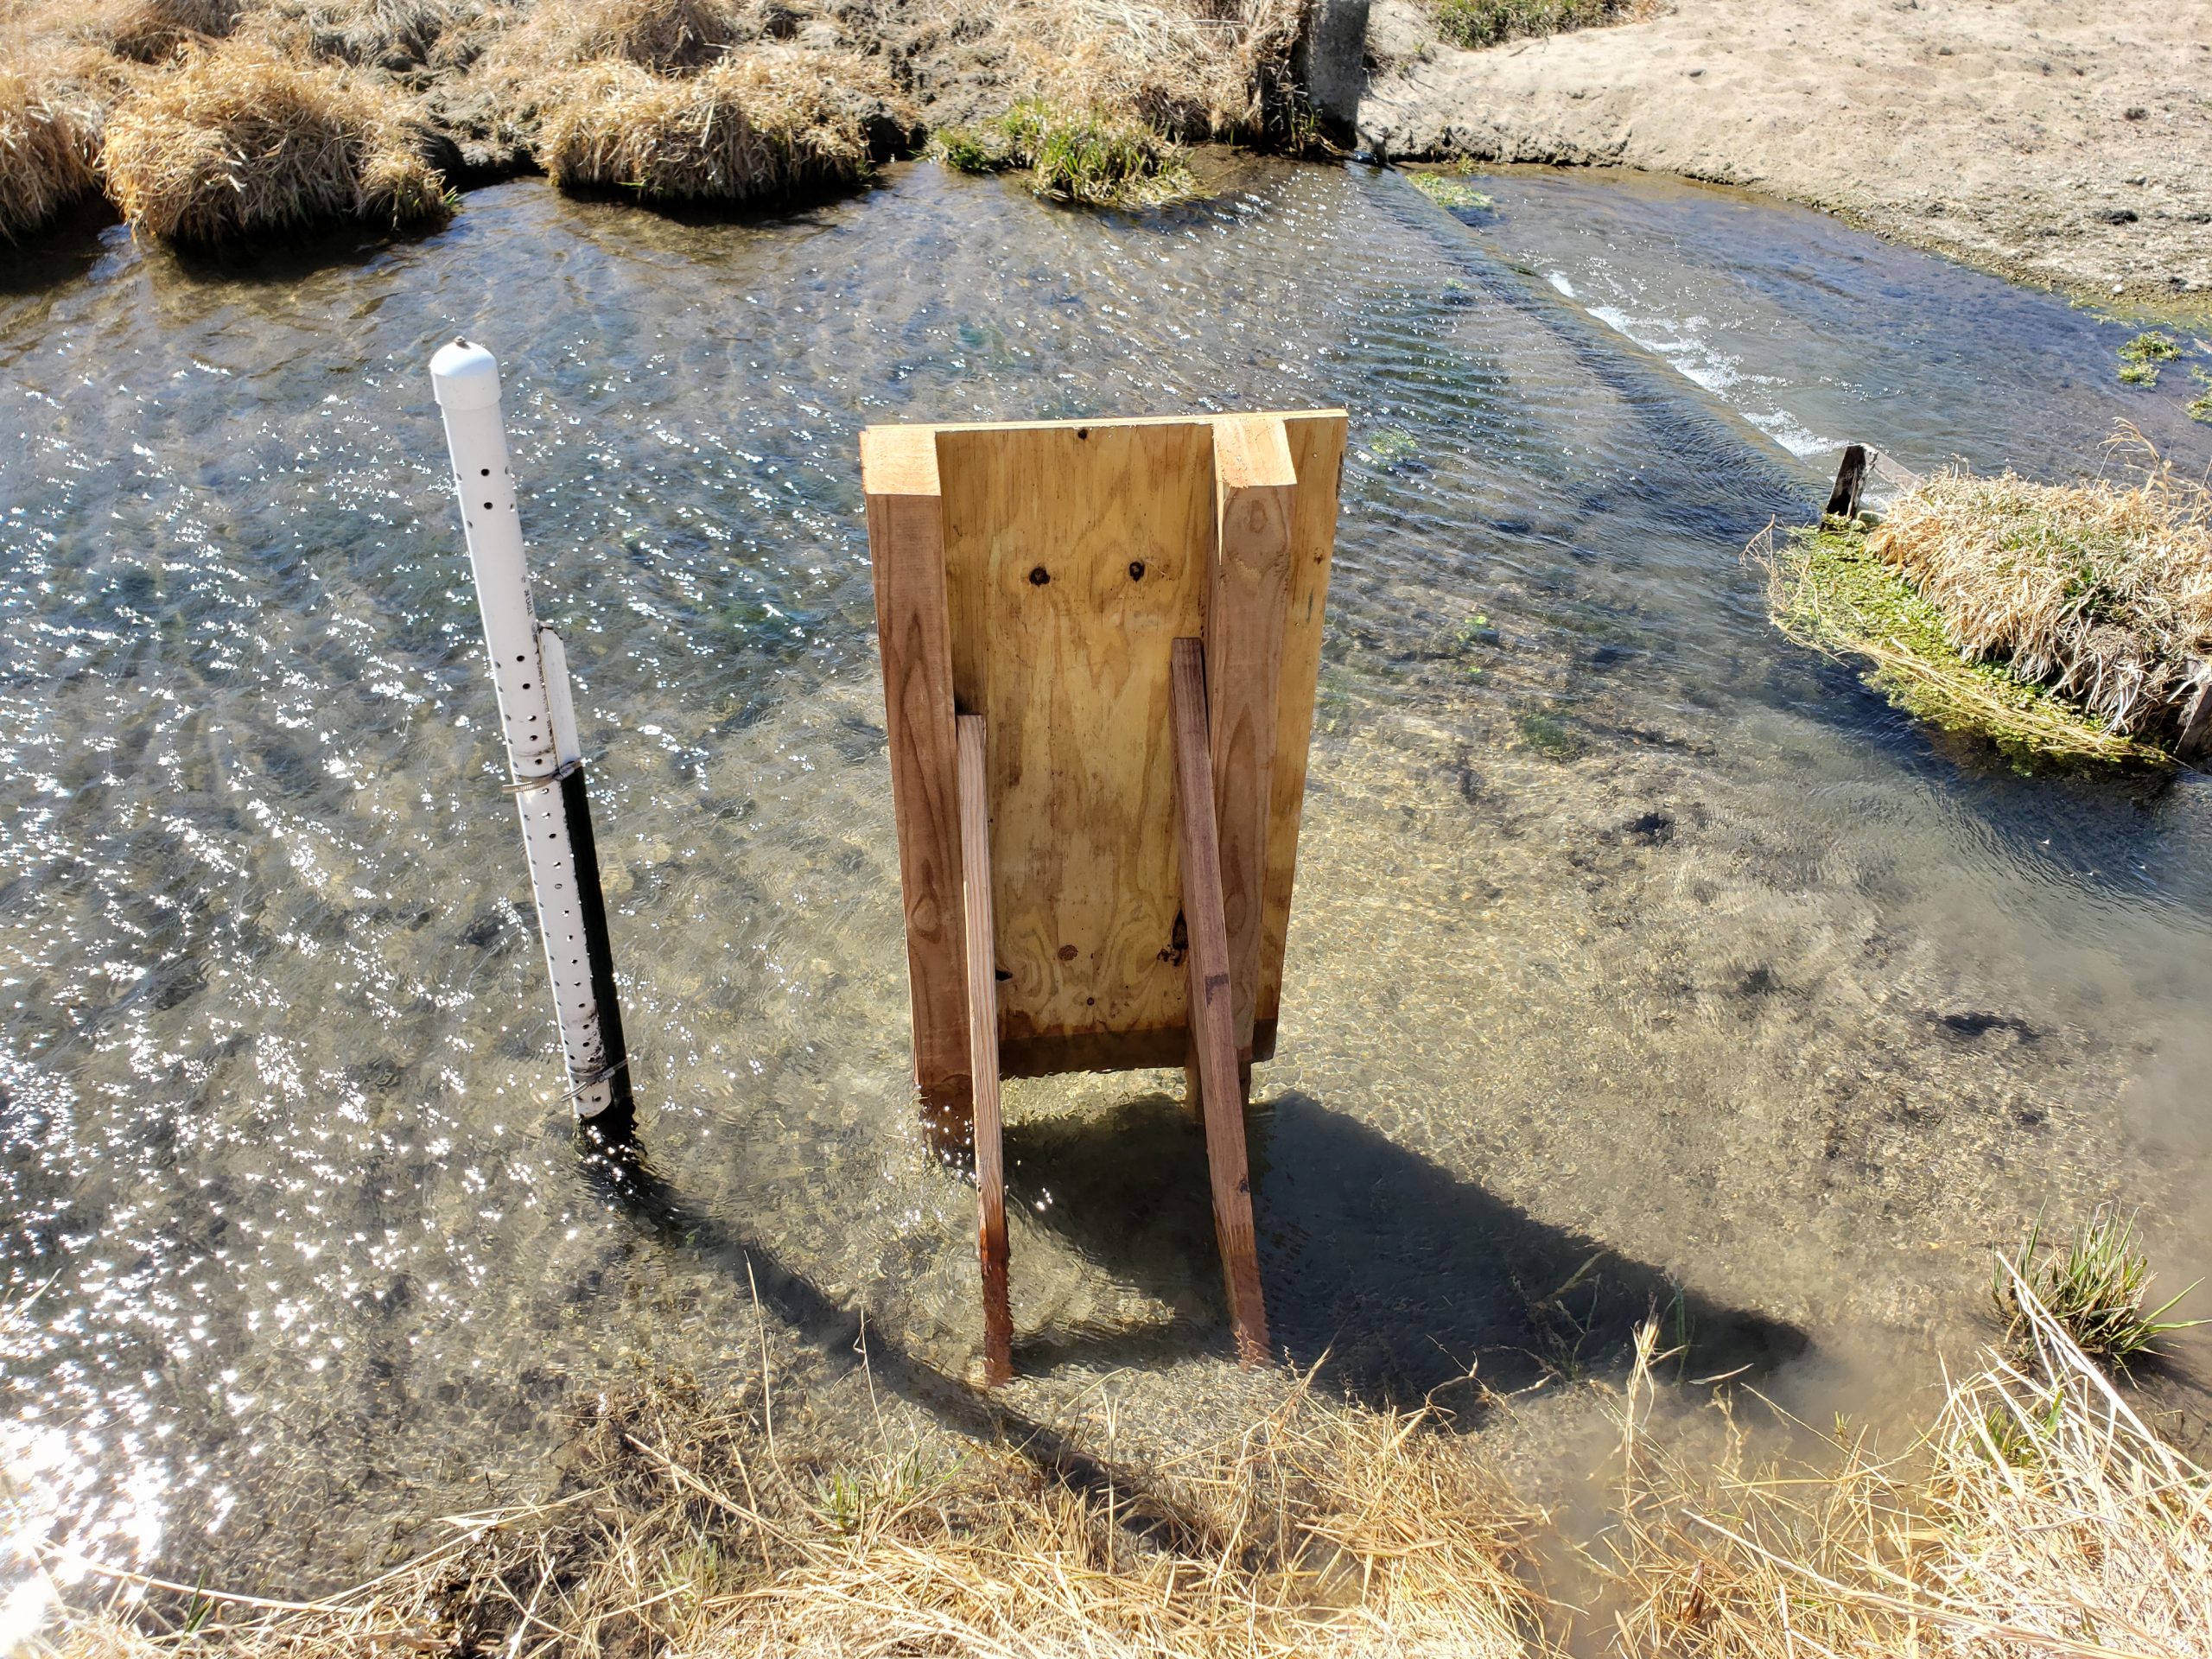
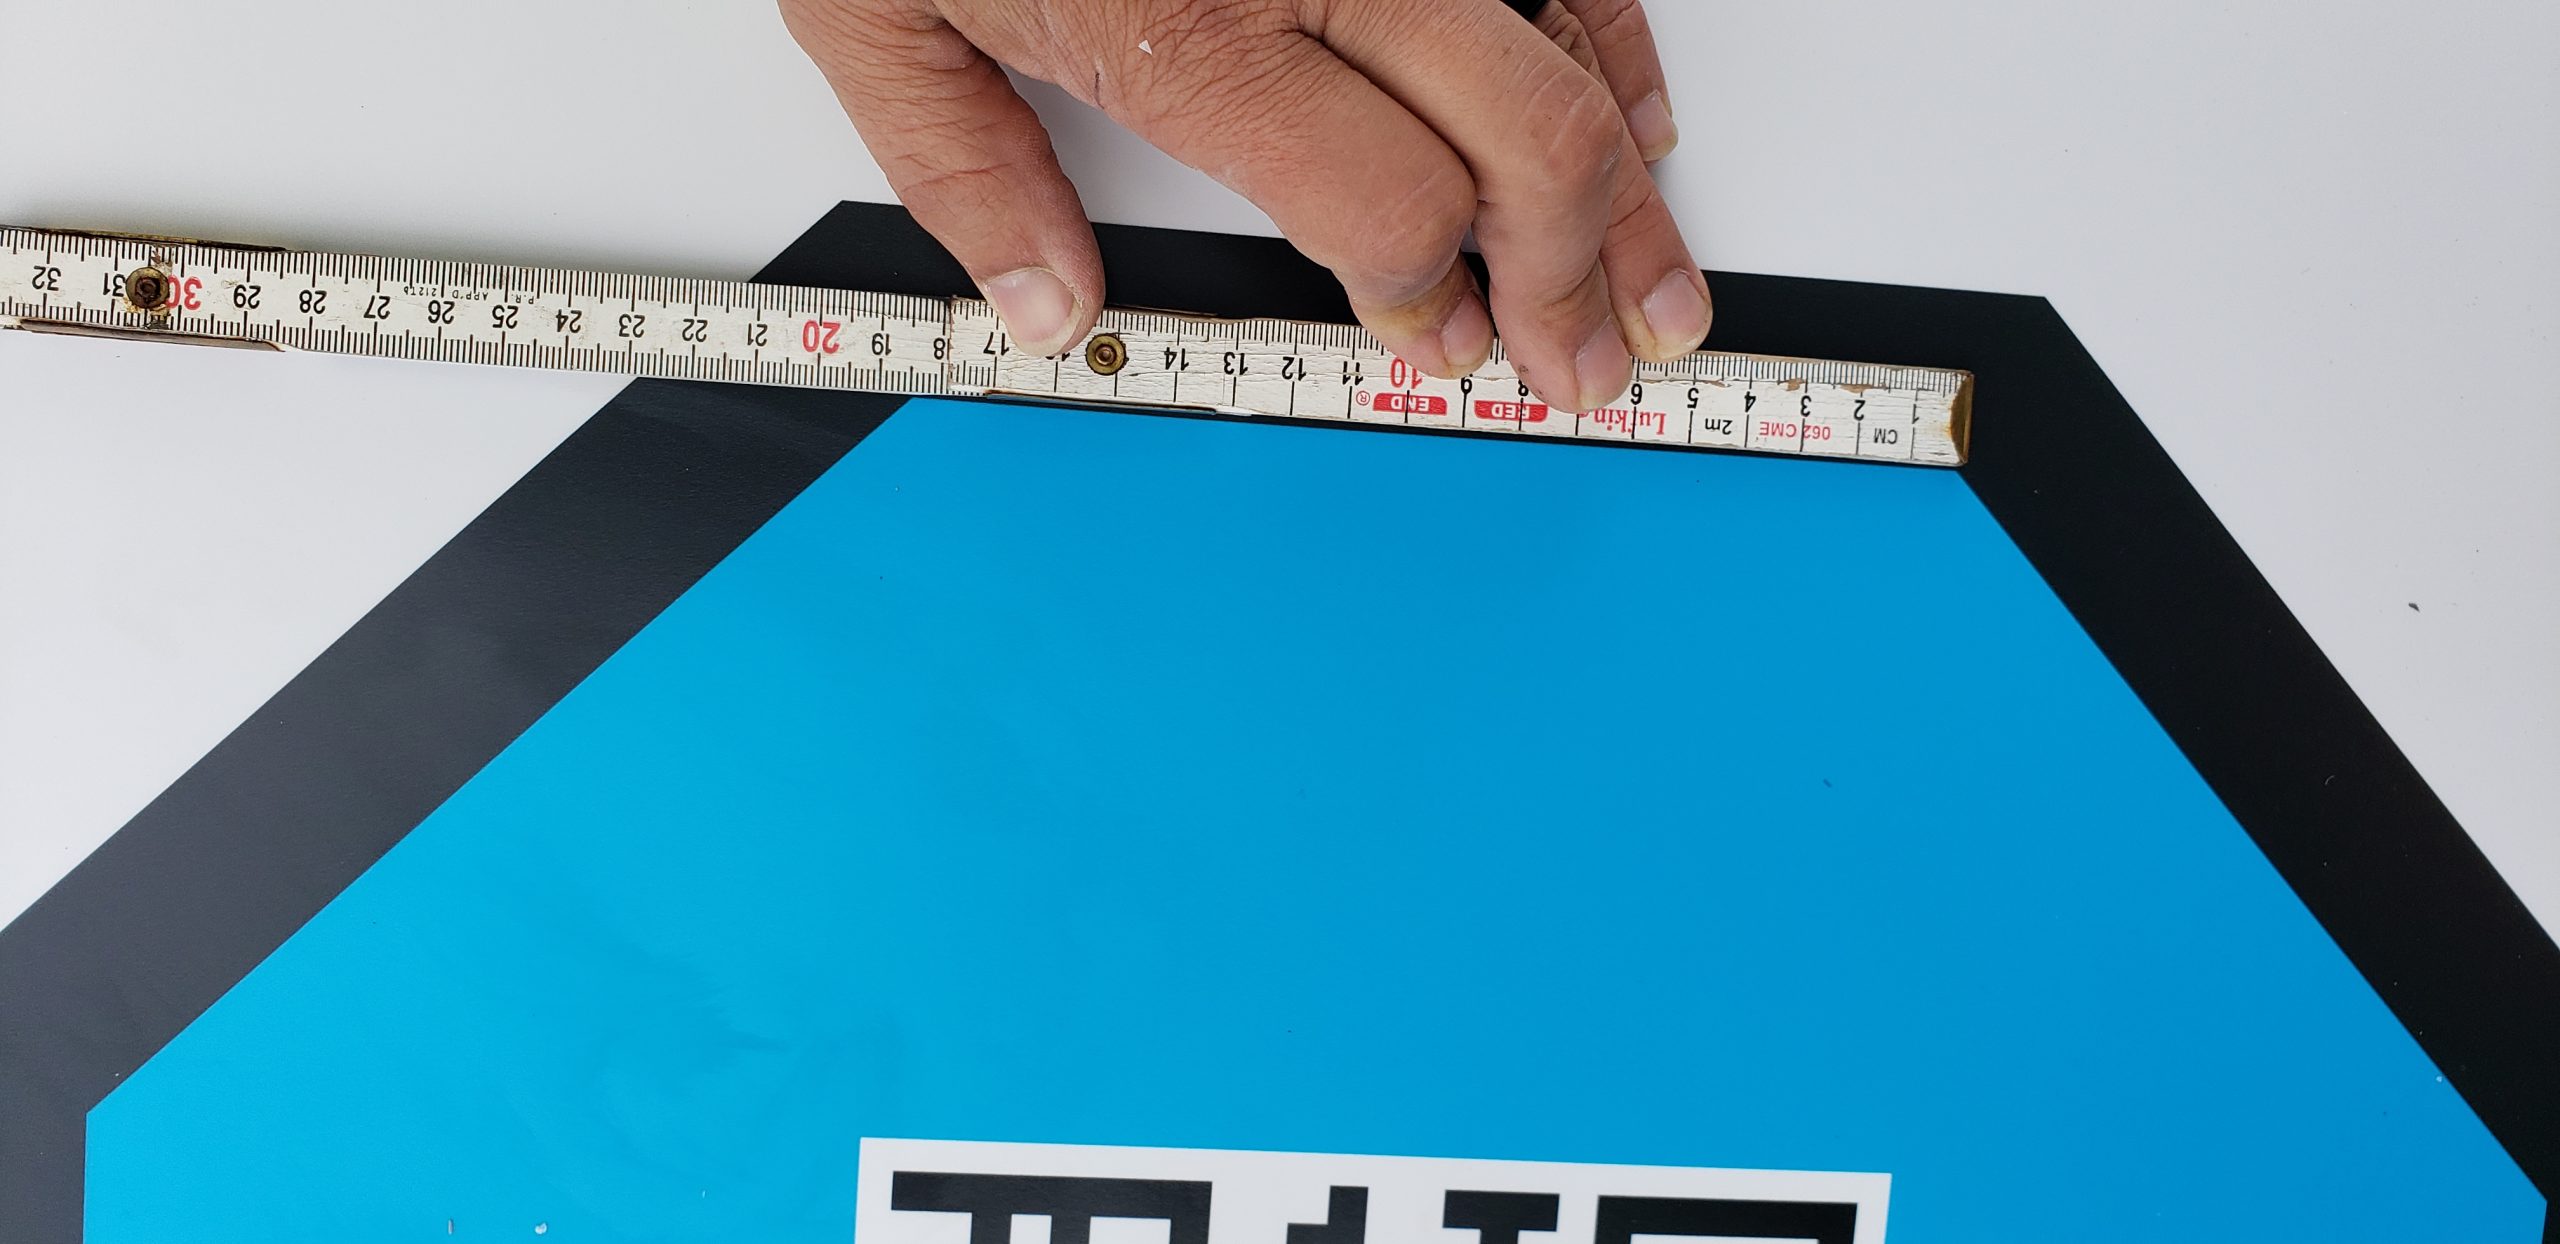
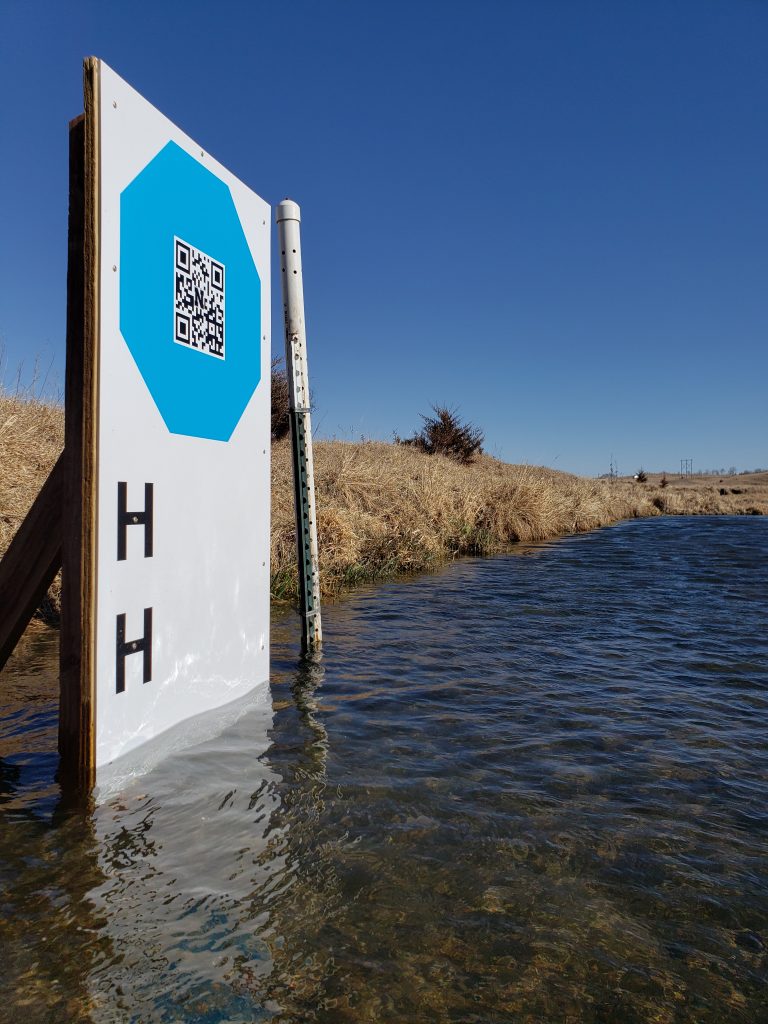
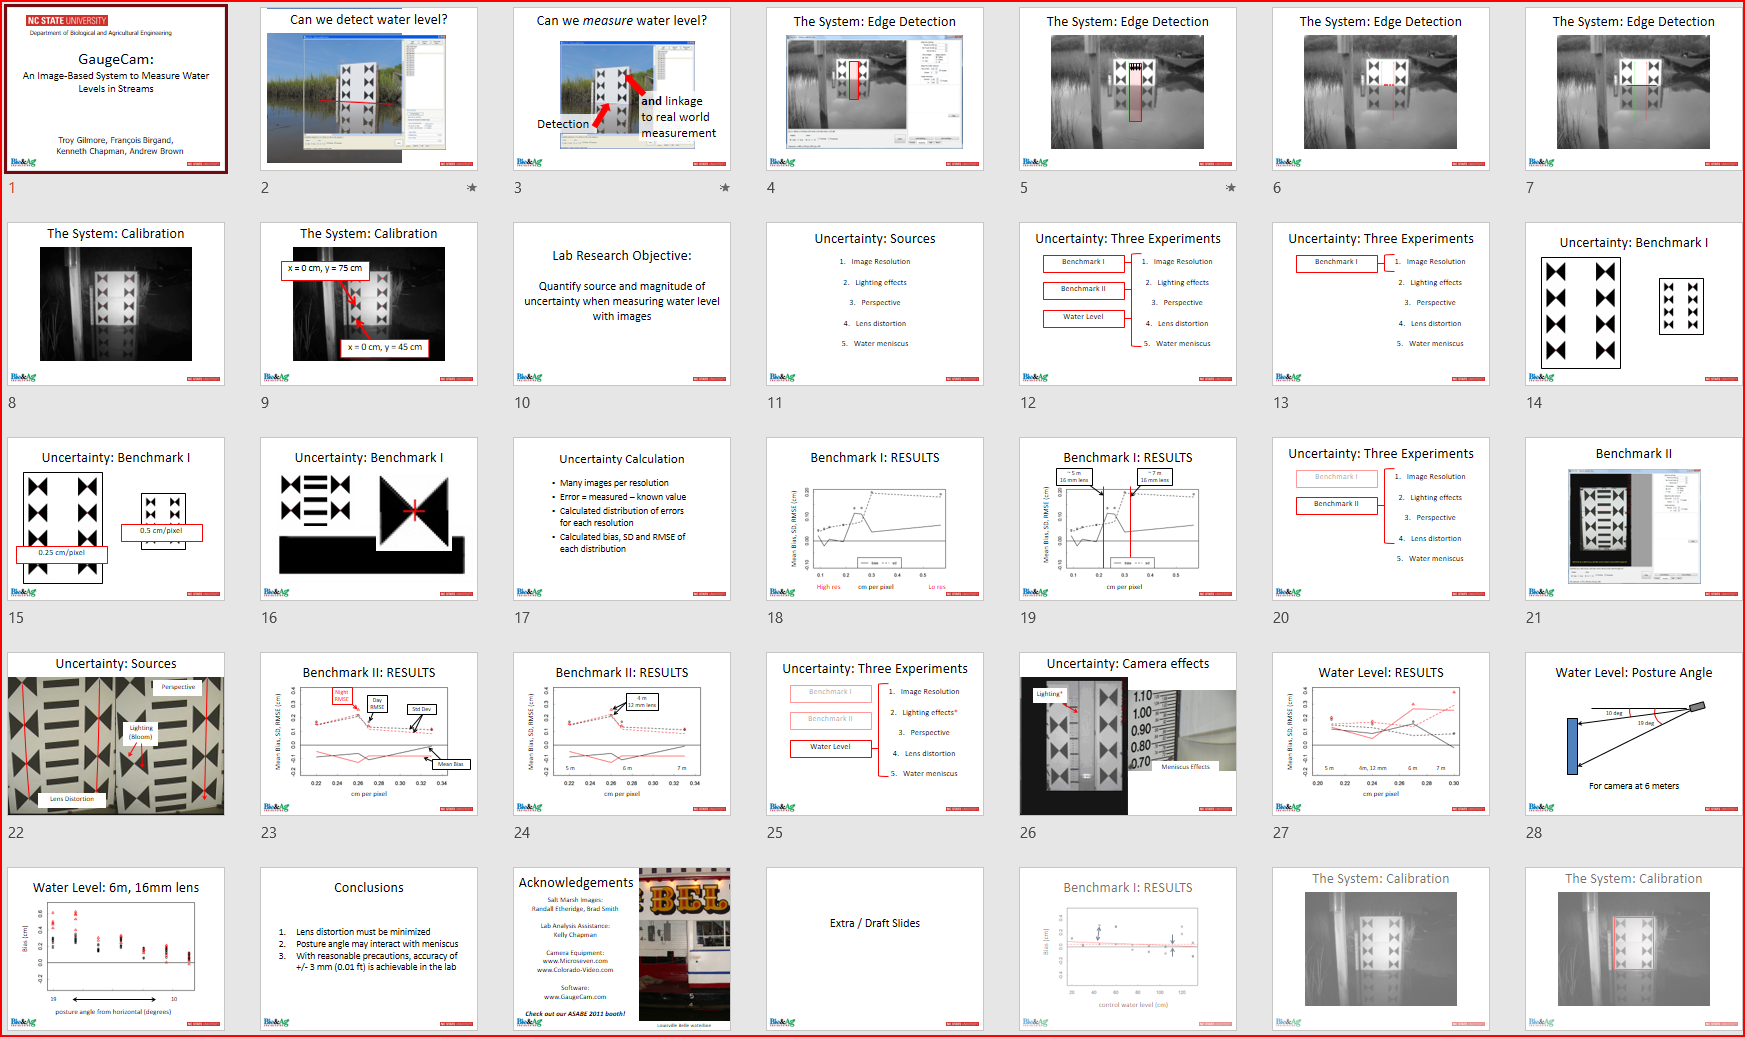
The project started in François Birgand’s lab at North Carolina State University. GaugeCam was my undergraduate research project and Ken Chapman wrote the open-source software to measure water level in highly conditioned time-lapse images. We published a paper in 2013 (Gilmore et al. 2013, Journal of Hydrology) showing potential precision of +/- 3mm, or about the height of a meniscus, in carefully controlled laboratory conditions. Application of GaugeCam showed increased uncertainty in a precisely installed and well-maintained field site in a tidal marsh in eastern NC (Birgand et al. 2022, PLOS Water). Uncertainty is still reasonable compared to other common water level monitoring methods. The current iteration of this mature, open-source software for measuring water level is the GaugeCam Remote Image Manager 2 (GRIME2), as described in a technical note in Water Resources Research (Chapman et al. 2022). More details, including major recent improvements to the ease of installation, are available at https://gaugecam.org/grime2-details/.

GaugeCam water level camera system targets in a stream in Nebraska.
GaugeCam stop-sign calibration target installed next to the original bow-tie target for water level measurement using cameras.

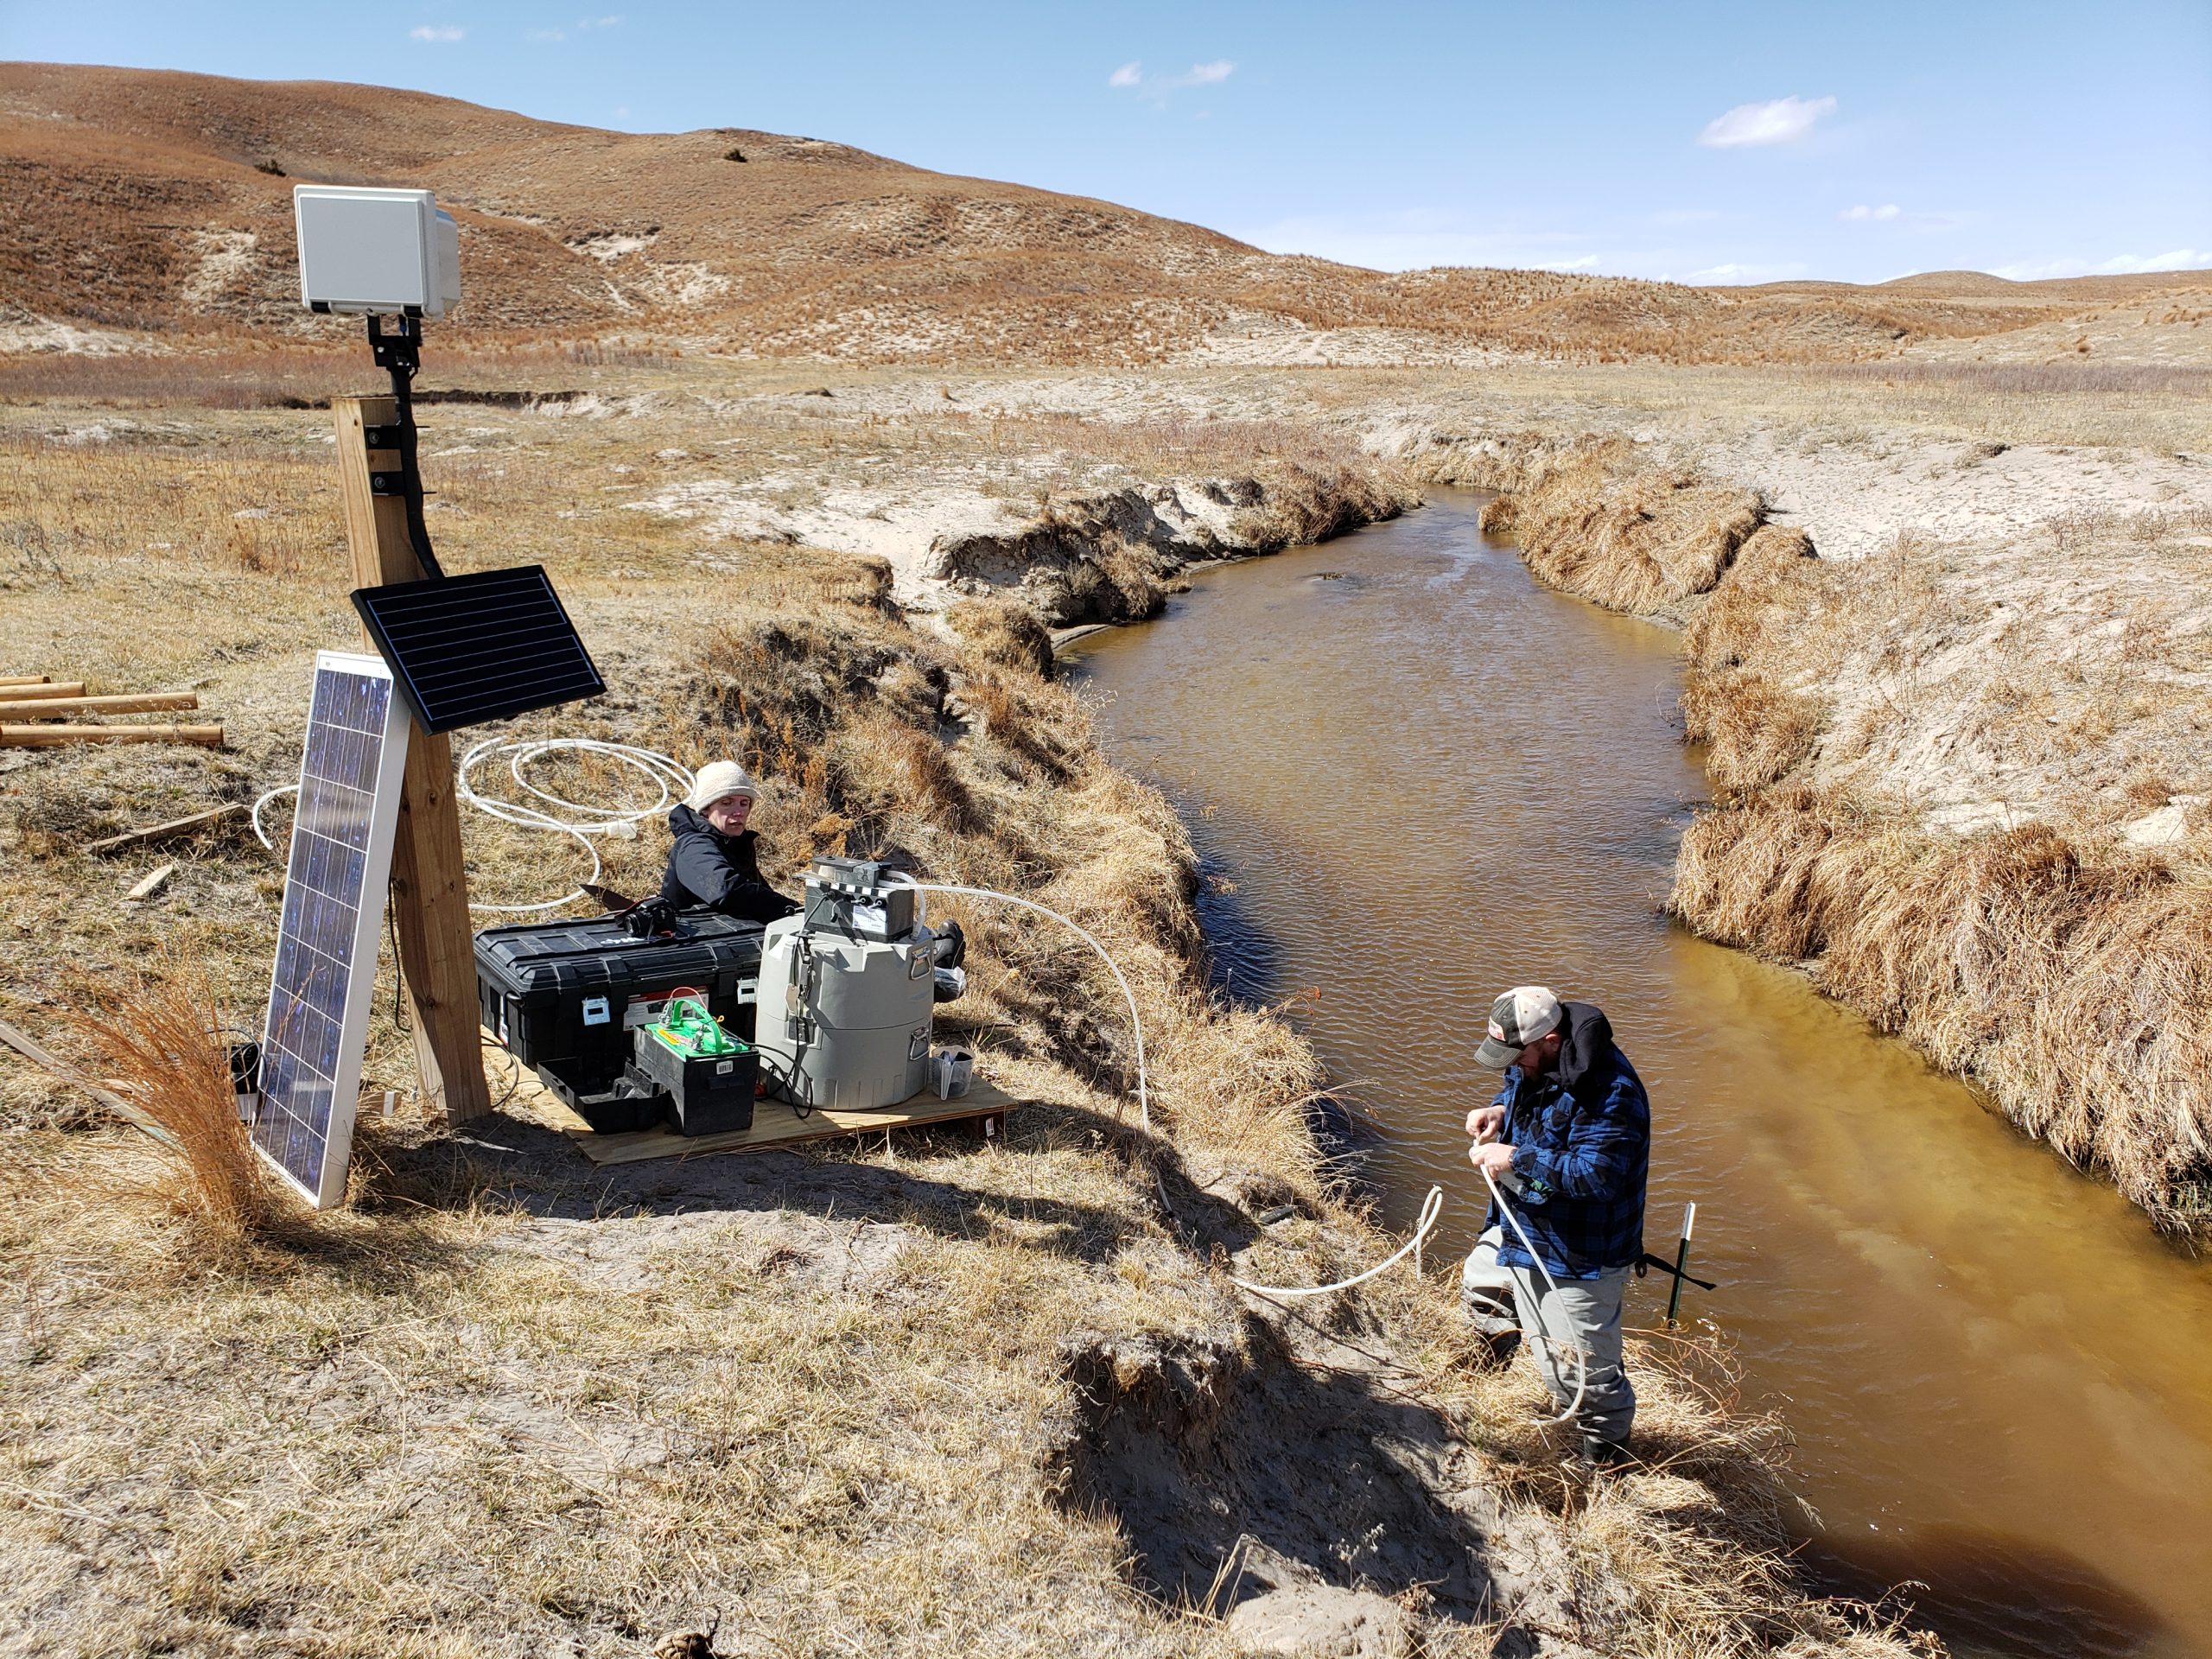
More recently, we have been working with Mary Harner (University of Nebraska at Kearney, see https://witnessingwatersheds.com) and her colleagues with the Platte Basin Timelapse (PBT) project (https://plattebasintimelapse.com). PBT has over 3 million high-resolution (DSLR) hourly daytime images from 60+ cameras across the Platte River basin. These images are available to University of Nebraska researchers for research and teaching purposes. Mary and her colleague Emma Brinley-Buckley had previously published research based on PBT imagery, for example, extracting the extent of wetland inundation from imagery. Similarly, Ken Chapman (now a PhD candidate at UNL) used PBT imagery to fill simulated data gaps in USGS stream gauge data (withdrawn preprint in HESS, now revised and in review in PLOS Water).

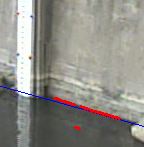
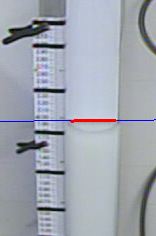
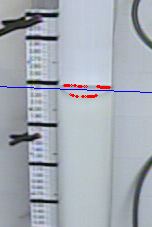
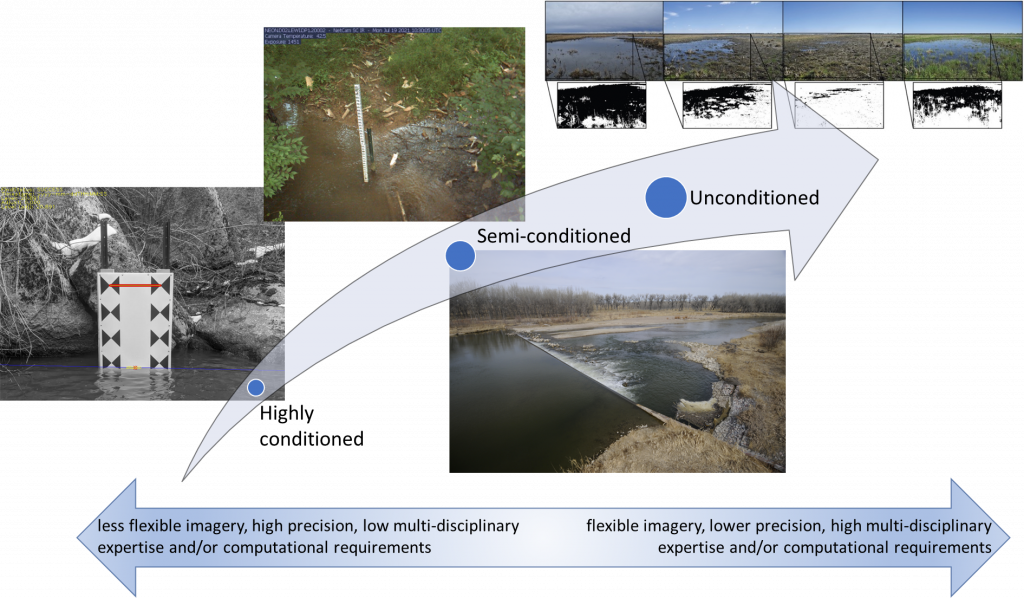
Thus, the inspiration for GRIME-AI, a software suite that will allow much broader application of time-lapse (camera trap) imagery in hydrological and ecological studies. In short, GRIME-AI is intended to help us move across the spectrum of potential image types that can be acquired from fixed ground-based cameras. The figure below shows this vision, starting with highly conditioned GaugeCam water level imagery on the left, to more flexible (but more difficult to handle) unconditioned imagery on the right. UNL PhD student John Stranzl is the lead programmer on GRIME-AI. More information is available at https://gaugecam.org/grime-ai-details/.

The image arc, from highly conditioned (left) to unconditioned imagery (right), accommodated by GRIME-AI software. Imagery courtesy of Idaho Power, PhenoCam, and PBT.
Screenshot of GRIME-AI software interface showing color clusters and other scalar image features extracted from an image of a stream in the Nebraska Sandhills.
GRIME-AI v0.0.2.2, for automated data acquisition from NEON sites, image triage, and extraction of scalar image features.

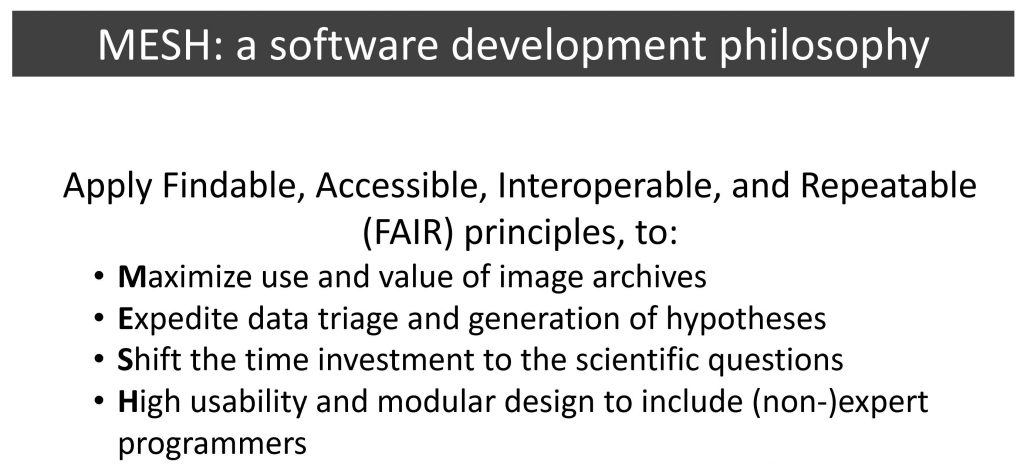
Long-term, our goal is for GRIME-AI is an open-source ecosystem that has the simplicity for new (very low barrier to entry for non-programmers) combined with the opportunity for experienced programmers to contribute to the capabilities of the software. A key guiding concept for GRIME-AI is that it should reduce mundane and repetitive tasks to the bare minimum, while still being powerful and flexible. Our software development philosophy is below.

MESH philosophy for the GRIME software ecosystem

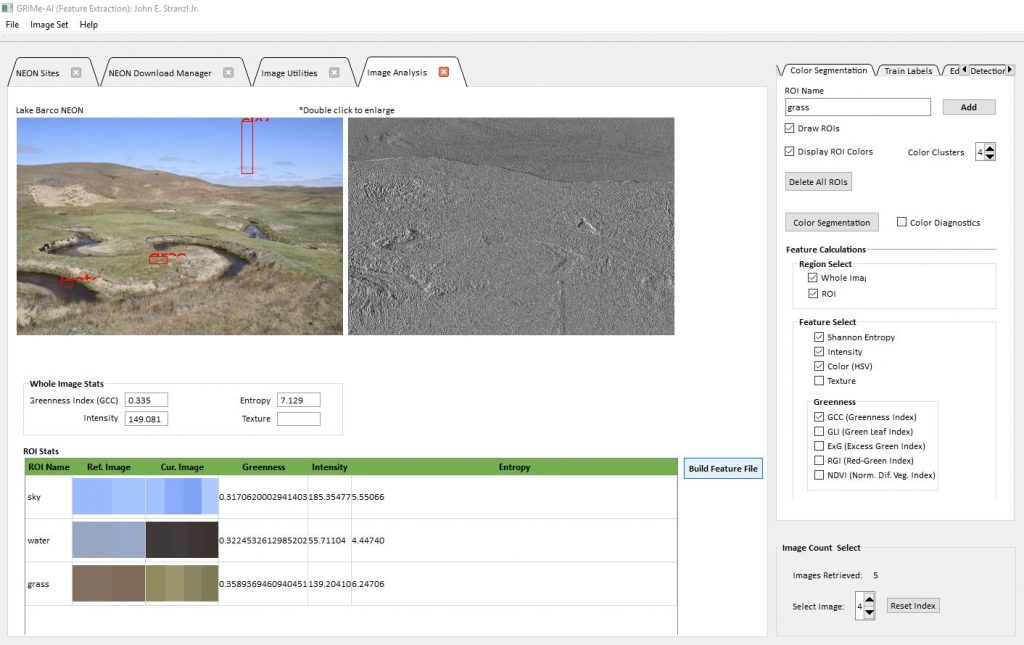
Early features enabled in GRIME-AI are as follows:

  • Automatic download of NEON data
  • Automatic download of PhenoCam images for NEON sites
  • Image triage (removal of dark and/or blurry imagery), with csv report
  • Visualization (overlays) of common edge detection algorithms (Canny, Sobel, ORB, etc.)
  • Custom region of interest (ROI) placement on reference image
  • Calculation of scalar image features for each ROI and whole image, including:
    • Color cluster analysis for each ROI and whole image
    • Greenness calculations for each ROI and whole image
    • Intensity and entropy for each ROI and whole image
  • Generation of csv with all selected scalar image features extracted for folder(s) (recursive) of images

The obvious next steps are:

  • Data fusion (combining other sensor data with scalar image features extracted in GRIME-AI)
  • Anchoring images/ROIs to account for camera movement
  • Capabilities to build classifiers from fused datasets
  • Automated image segmentation

What does it take to install GaugeCam? Here are the gritty details and caveats.

Today I wrote a long email to a colleague interested in setting up GaugeCam. Why not share (a lightly-edited version) with the world?!

First, here’s a recent animation of me installing a target. This might take a moment to load.

animation of image-based water level camera installation
Installation of stop-sign target for GaugeCam water level measurement system.

Second, there are a number of additional resources available at https://gaugecam.org/grime2-details/, including this document that describes the installation details for a bowtie target at our North Carolina tidal marsh site: http://gaugecam.org/wp-content/uploads/2022/06/Gaugecam_org_background_installation_guideline.pdf.

A small photo gallery of a stop-sign target installation in Nebraska:

Some practical considerations and details:

  1. The first question that needs to be answered is the level of reliability and accuracy that is required for your application. If this is an easily-accessed (for maintenance) “demo” site, then this system is perfect for facilitating science communication, etc. If it’s a remote site, with only occasional access for maintenance and data collection, we strongly recommend putting in a cheap transducer alongside the GaugeCam system (e.g., HOBO, $300).
  2. Accuracy depends on (1) how many real-world mm or cm are represented by each pixel in the image, and (2) the quality of installation and maintenance of the background target. The following are issues to consider for field application:
    1. In controlled lab experiments, we can achieve high accuracy (+/- 3 mm, about the size of a meniscus; see Gilmore et al. 2013).
    2. In a carefully maintained tidal marsh installation, accuracy was less, but still quite good (see Birgand et al. 2022).
    3. You will encounter foggy mornings, spider webs on lens, and other similar environmental issues when using cameras. Expect data gaps of minutes to hours due to these issues.
    4. While biofouling is a universal problem for many reasons for many applications and industries, we are actively working to mitigate biofouling affects in our application. In the nutrient-rich agricultural streams where we work, biofouling accumulates within 7-10 days, which requires regular cleaning.
    5. The background must be plumb (perpendicular to the water surface).
    6. The original bow-tie target (template here, nominally 3’ x 4’) was used in the studies above. The new stop-sign target (template here, nominally 2’ x 4’) is experimental, but is smaller and still seems to give pretty good results. The bow-tie requires a survey of the real-world location of bowtie intersections. The stop-sign target requires only the facet length measurement (assumed to be the same for all 8 facets on the printed target) and reference measurement from the bottom left corner.
  3. In terms of installation, here is a parts list from my recent installations in sandy to slightly gravelly streambeds:
    1. Target
      1. Target background, matte print laminated on plexiglass*
      2. Two treated 4×4 posts, 8’ long [NOTE: before digging post holes you should have utilities located; contact your local utilities for this (usually free) service!]
      3. Two treated 2×4 boards, 8’ long
      4. Two Post- Base Spike for 4×4 Nominal Lumber**
      5. One ¾” treated sheet of plywood***
      6. Short (1” or 1 ¼”) pan-head screws (for attaching the plexiglass to the plywood)
      7. Long (3”) outdoor decking screws
      8. Thin wood wedges or spacers (for adjusting background so it is plumb – you might be able to cut these in the field)
    2. Camera
      1. We suggest Reconyx cameras due to their quality, though nearly any game camera will do
      2. Suggest RAM mount products to minimize any camera movement (example 1, example 2)
      3. Suggest adding a lock on camera for security
      4. Suggest treated 4×6 post for mounting the camera; 4×4 post as very minimum.
      5. Camera can be mounted on a large tree or similar, but this will usually create a good bit of movement of the camera. Small amounts of movement can be handled by the software, but minimal movement is better.
    3. Tools that you need (at the very minimum)
      1. Sledge hammer
      2. Post hole digger
      3. Cordless drill
      4. Cordless saw(s) (at least a reciprocating saw)
      5. Level
      6. Measuring tape
      7. Screwdriver

*We are looking for a better alternative that does not require as much cleaning and/or is more resistant to biofouling. The matte finish seems like a good attachment surface for biofouling. If you find a local sign shop for printing, I can send you the contact info for my sign shop so they can talk.

**I have used these in the sandy streams, where I cannot dig holes more than ~1 ft into the streambed (the sand collapses in), so adding these spikes on the bottom helps solidify the installation.

***You can print the background on very thick plexiglass and skip the plywood, but I found this to be expensive. So I printed on ¼” plexiglass and mounted on plywood backing.

From bowties to stop signs

In our last post, we promised to tell you about some ongoing work. Our current target backgrounds use pattern matching to find and precisely locate calibration points. Given our experiences with GaugeCam testers, we’re looking to simplify the installation and calibration process without sacrificing too much accuracy. Currently in testing is our “stop sign” calibration target. This feature is not yet live in the GRIME2 software, but we are installing these backgrounds in two locations for testing. At both locations we have HOBO water level loggers for comparison. At one location we will have an adjacent bowtie target installed. Our first location was installed yesterday, with deep gratitude to the landowner who is interested in this work. A photo and time-lapse of the installation are below!

Calibration target for image-based water level measurement
Stop sign calibration target installed in Bazile Creek watershed.
animation of image-based water level camera installation

Getting emotional about water level cameras

Hydrologic modelers like to say “all models are wrong, but some are useful.”

And more recently (via @bisnotforbella), “All models are wrong but some I am emotionally attached to.”

Those of us working on GaugeCam have an emotional attachment to bowties. Because bowties are the shapes that have helped us model the real world by relating pixels in an image to real locations in the image scene.

This post is the first in a series that will explain the history of this emotional attachment, and why it may change in the future.

First, a step back to 2009. Here are some of the first calibration target designs we tried. Circles, bowtie-ish circles, and secchi disk shapes. Tossed in with some horizontal lines to test our water line finding algorithms.

Our first testing used 5.5-inch circular patterns. We did this work in the lab and in the field. Below is the Pullen Park site where we eventually installed two columns of circular fiducials.

Along with the calibration shapes, we had to test line find algorithms to detect the water line. We had some hits and some misses, both in the lab and field.

In the images above, you can quickly see why we were looking for calibration patterns other than classic staff gauges. Our low resolution images at the time didn’t help, but it was very clear that the intuitive idea of just putting staff gauges in the image scene for calibration was not our best path forward.

By 2011 we had developed and tested bowtie targets using both benchmark patterns (synthetic water lines) and real water levels in the lab at North Carolina State University. We presented these results at the American Society of Agricultural and Biological Engineers Annual Conference in Louisville, KY.

Honestly, these are great memories. This was my undergraduate research and some of the early research in the Birgand Lab at NCSU. We also had great volunteers on the project, most notably Ken Chapman, who brought the machine vision and software programming skills necessary to create GaugeCam.

Bowties are still central to our work. But be sure to check back to find out how we’re moving GaugeCam forward!