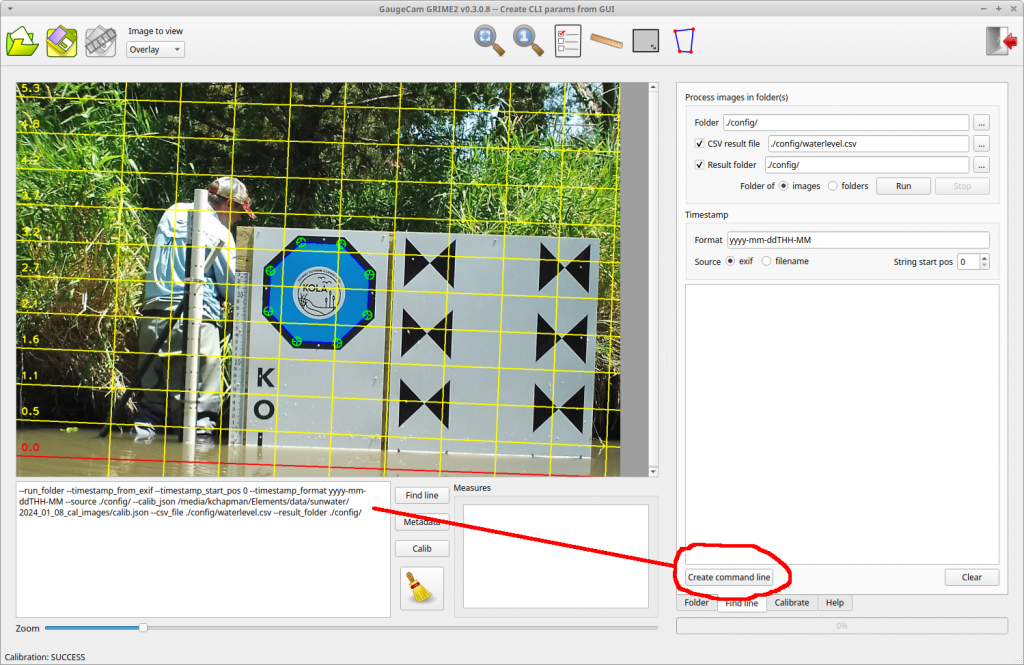
This release makes the creation of CLI calls much easier. The ROI’s and other parameters you select in the GUI can be used to create CLI parameters and output them as test to the textbox below the main image. There are two “Create command line” buttons: one on the Calibration tab and one on the Find Line tab.
Building on the successful WaterFront Software and KOLA Data Portal projects, we embarked on another student-led adventure in the Fall 2023 semester! Professor Elizabeth López Ramos connected the GRIME Lab team with an excellent student team at Tecnológico de Monterrey (ITESM). These students led the Data Fusion Project.
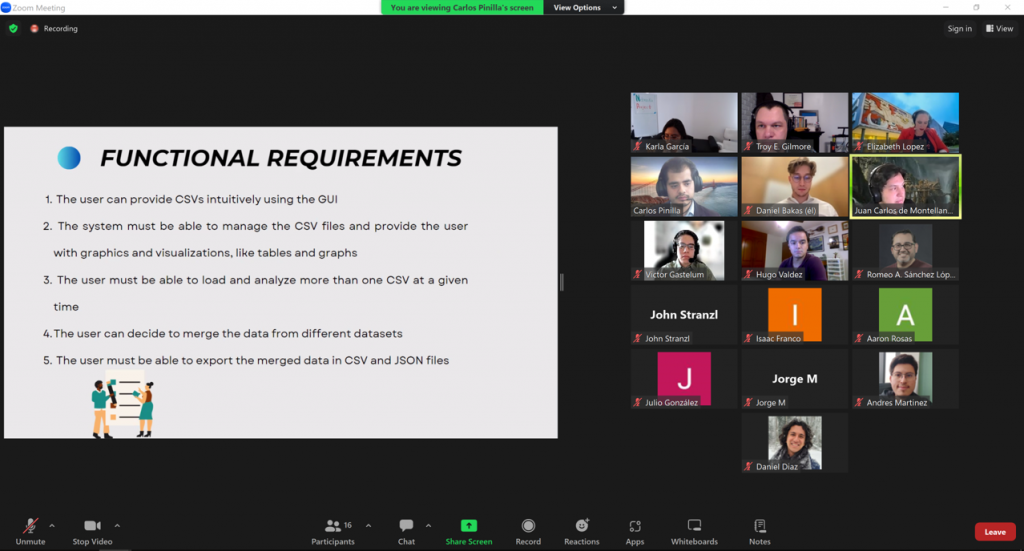
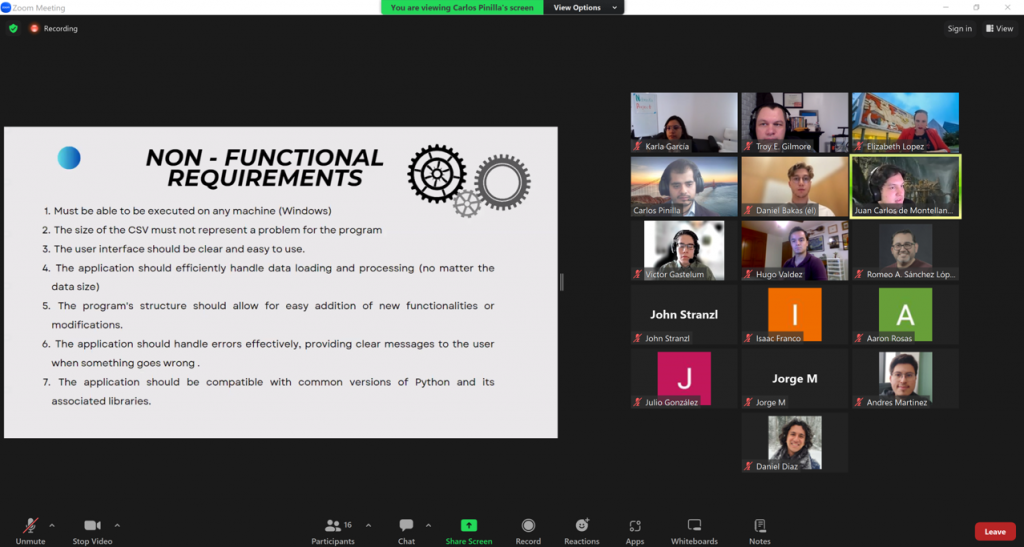
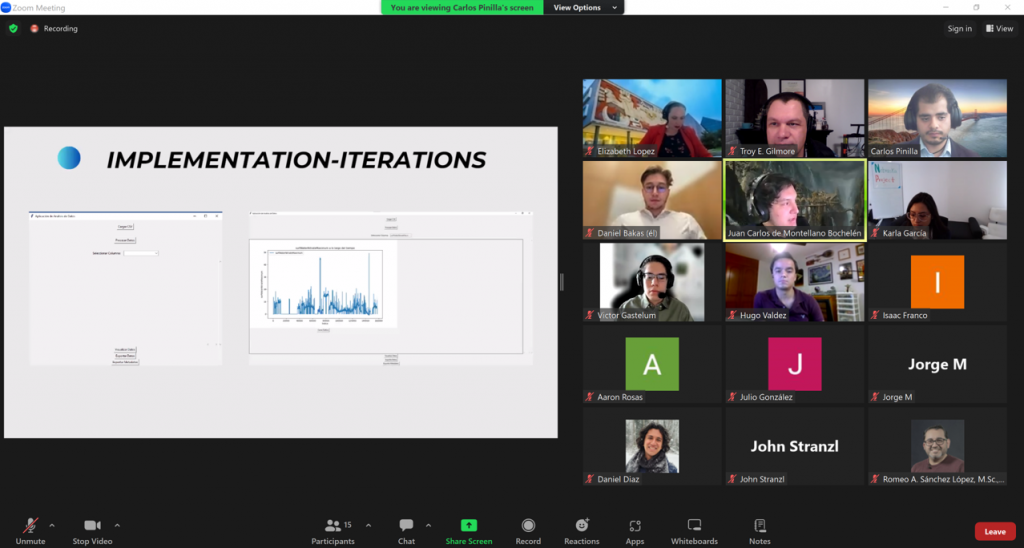
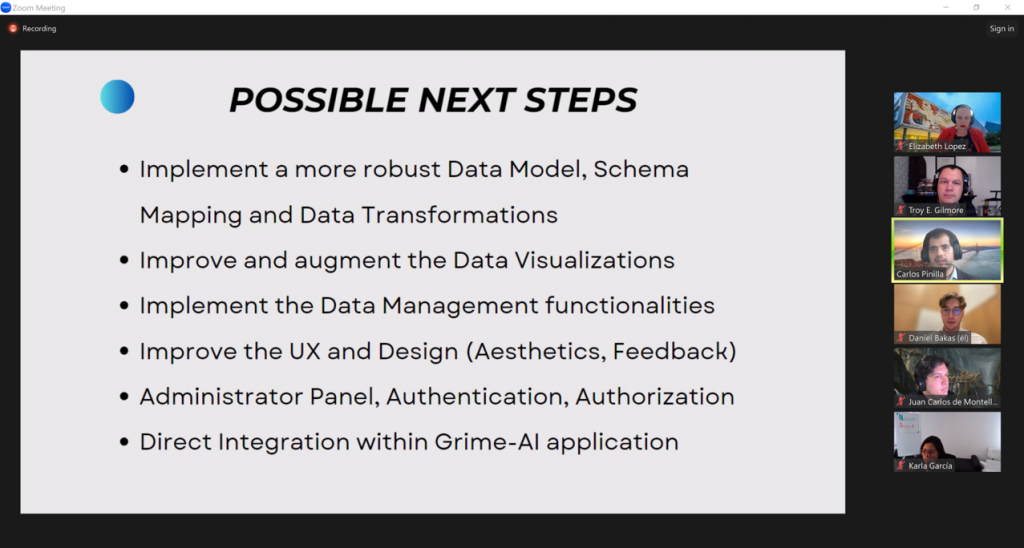
The Data Fusion Project is a first step toward integrating data fusion features in the GRIME-AI user interface. And the ITESM team dived DEEP into the software development life cycle on this one! As “clients” the GRIME Lab team had multiple meetings and filled out an extensive questionnaire. This made us really think through the requirements we desired. The ITESM team extensively documented this process, which is a major benefit to everyone going forward. Below are some screenshots from the ITESM team’s final presentation.
Functional requirements defined through client interviews, questionnaires and prototyping.Other requirements identified.Screenshot of live demo during the final presentation. The GUI was built using tkinter. CSV files can be loaded, data merged based on timestamps and data can be visualized.
The ITESM did a great job of working across campuses and completing a lot of behind-the-scenes work required to finish this project. Their project can be found on GitHub.
Overall, we are grateful for the opportunity to work with the ITESM Team. They were very professional and worked hard to create a viable product!
This post builds on our recent update about GRIME-AI capabilities. The previous post (and video) described features in GRIME-AI that are reasonably stable (although subject to occasional changes in APIs for public data sources). The description below is our current roadmap to a full GRIME-AI suite of tools for using imagery in ecohydrological studies. Please contact us if you see major gaps or are interested in helping us test the software as new features are developed!
The following features are implemented or planned for GRIME-AI:
You will notice asterisks that indicate *planned future functionality (timeframe = months to years) and **functionality under development (timeframe = weeks to months). All other features are developed, but subject to additional user testing as we work toward a stable public release. GRIME-AI is being developed open source commercial friendly (Apache 2.0).
Acquire PhenoCam imagery and paired NEON sensor data
Acquire USGS HIVIS imagery and paired stage, discharge and other sensor data
Data cleaning (image triage)
Automatically identify and remove low-information imagery
Choose precision for “paired” timestamps (e.g., +/- 5 min between image timestamp and other sensor data timestamp)*
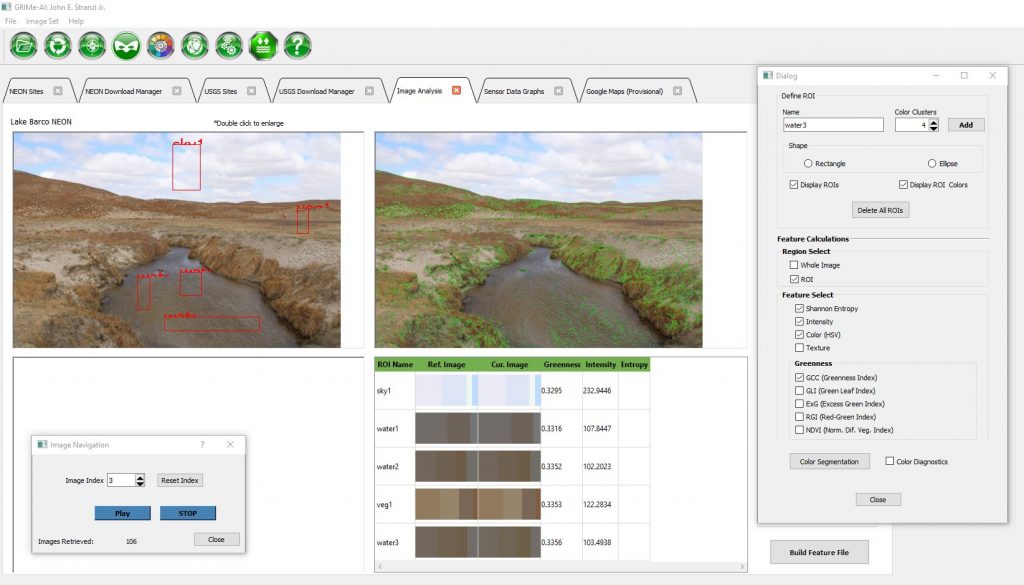
Image analysis
Calculate and export scalar features for ML with low computational requirements
Image analysis algorithms include:
K-means color clustering (user selected, up to 8 clusters, HSV for each cluster)
Greenness index (PhenoCam approach)
Shannon Entropy
Intensity
Texture
Draw masks for training segmentation models**
Draw polygon shapes
Save masks and overlay images**
Export mask**
Image calibration and deterministic water level detection (currently a separate Windows installer called GRIME2, but we have command line to implement this in GRIME-AI)**
Draw calibration ROI for automatic detection of octagon calibration targets
Draw edge detection ROI for automatic detection of water edge
Enter reference water level and octagon facet length
Process image folders
Save overlay images
All scalar feature values, ROIs and polygon shapes exported as .csv and .json*
Data products and export*
Documentation of data source and user decisions, where final datasets include:
Metadata for all source data*
Documented user decisions from data cleaning and data fusion processes*
Documentation of calculated image features*
Sample image overlay showing location of ROIs*
Sample image showing segmentation masks and labels*
Coordinates and labels of all ROIs (.csv and .json)*
Breakpoints for major camera movement, image stabilization, or other major changes in imagery*
A .csv and a .json file with aligned, tidy data that is appropriate for training/testing ML models*
Metadata appropriate for storing final data product (scalar data only) in CUAHSI HydroShare or similar data repository*
Documentation of imagery source, including timestamps and metadata for original imagery retrieved from public archive*
Modeling and model outputs*
Build segmentation models (e.g., to automatically detect water surfaces in images)*
Build ML models from scalar image features and other sensor data and/or segmentation results*
Export model results, performance metrics, and metadata*
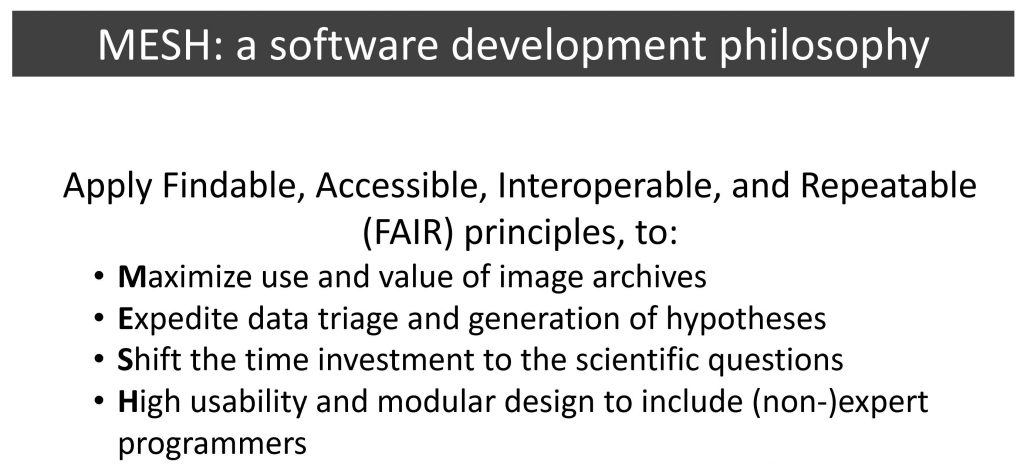
All of the above are being developed under the MESH development philosophy:
In Spring 2023 the GaugeCam team at the University of Nebraska worked with two excellent student groups on their capstone projects in the Departamento de Computación and Escuela de Ingeniería y Ciencias at Tecnológico de Monterrey (ITESM).
The first group we are featuring is the KOLA Data Portal Team. These students did an amazing job creating a web interface for multimodal environmental data! Professor Elizabeth López Ramos was the instructor for this capstone course.
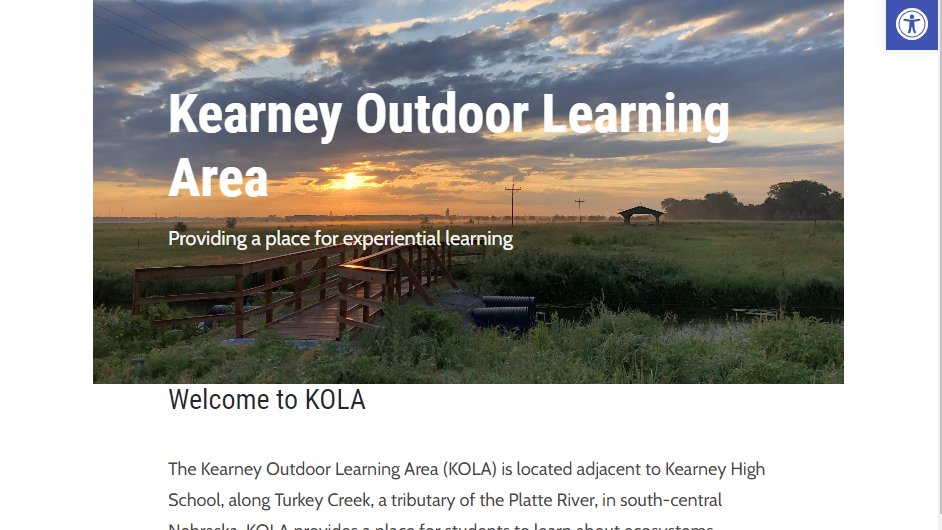
This project was focused on creating a data portal for the Kearney Outdoor Learning Area (KOLA) site that is located next to the Kearney, NE High School. The project was designed to simulate real interaction with clients and included two phases.
PHASE 1: Gather list of client requirements and develop proposal.
Requirement gathering and analysis based on meetings with client.
Research and brainstorm to devise innovative and practical solutions.
Create a concise proposal outlining solutions, timeline, budget, and benefits for the client.
Present refined proposal to the client, highlighting alignment with requirements and receiving feedback.
PHASE 2: Build out the data ingestion platform based on the accepted proposal.
Construct platform, including features and functionality described in the proposal.
Test platform functionality, performance, and security to meet client requirements and industry standards.
Present the platform to the client for feedback and iterate to meet expectations and requirements.
A view and description of KOLA can be seen in the screenshot below.
A view of KOLA courtesy of https://outdoorclassne.com.
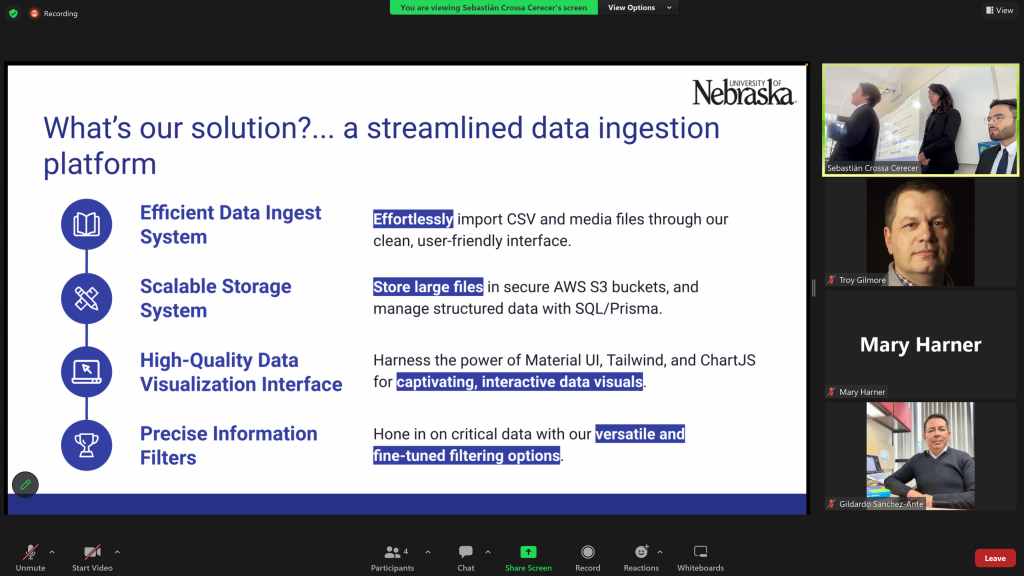
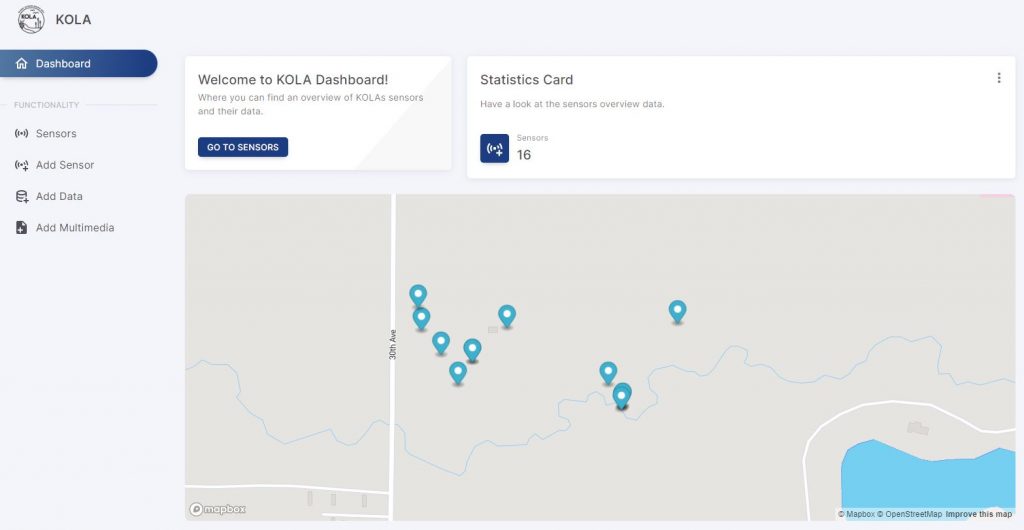
The key deliverables for the KOLA Portal project included the ability to upload and access several types of sensor data, including sound recordings, imagery, and scalar data (e.g., water levels). We met weekly with the KOLA Team. Students led those meetings, providing important updates and proposing next steps. As described in their final presentation, their solution consisted of the following:
The KOLA Portal has an attractive welcome screen, including a site map showing the various sensors that provide environmental data.
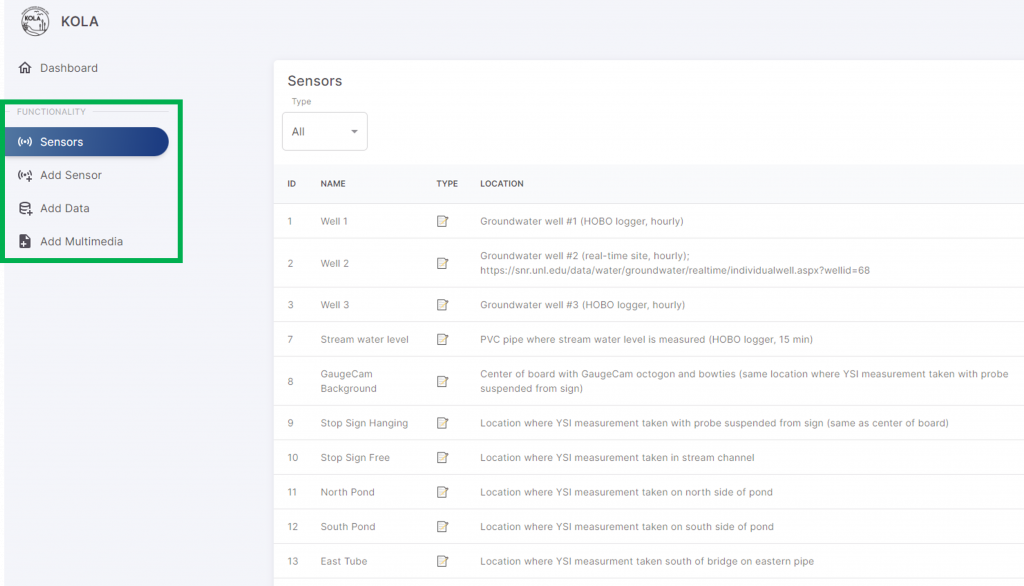
The green rectangle in the screenshot below highlights how we can now navigate from viewing the sensors, to adding a sensor, adding scalar data, and adding multimedia data on the platform.
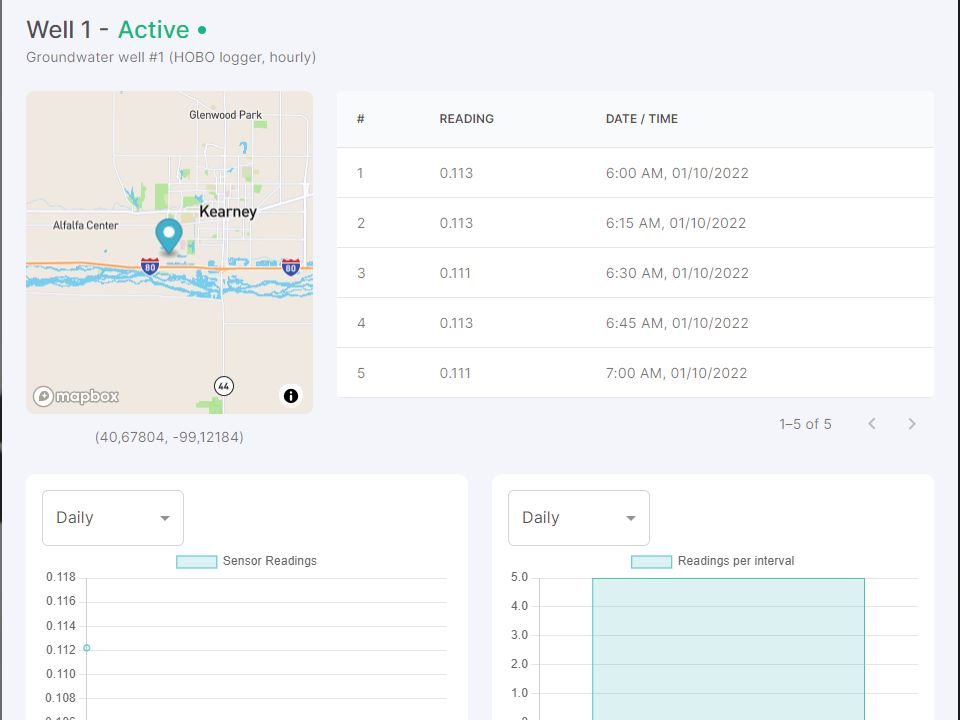
The portal also allows us to view sample data we provided the team, as shown below.
The KOLA Team also provided excellent documentation of the whole project! This was provided in a summary handoff email at the end of the semester. The video below shows the User Manual for the portal. The team also provided (1) an API reference and (2) a deployment guide that walks the user through the process of setting up the environment, navigating the codebase, and deploying the portal with the Next.js framework and Vercel hosting platform.
Overall, the KOLA Data Portal Team were highly productive and very professional. We are very grateful to Professor Elizabeth López Ramos and Professor Gildardo Sánchez Ante for involving us in the course. We learned a lot in the process and would love to work with other ITESM students in the future!