We have a new GRIME2 release. It is a bug-fix release that allows the program to run a little more quickly and use less disk space when the octagon target is used. We were creating unneeded debug information and images that have been removed.
Download and use the following installer to replace the previous software:
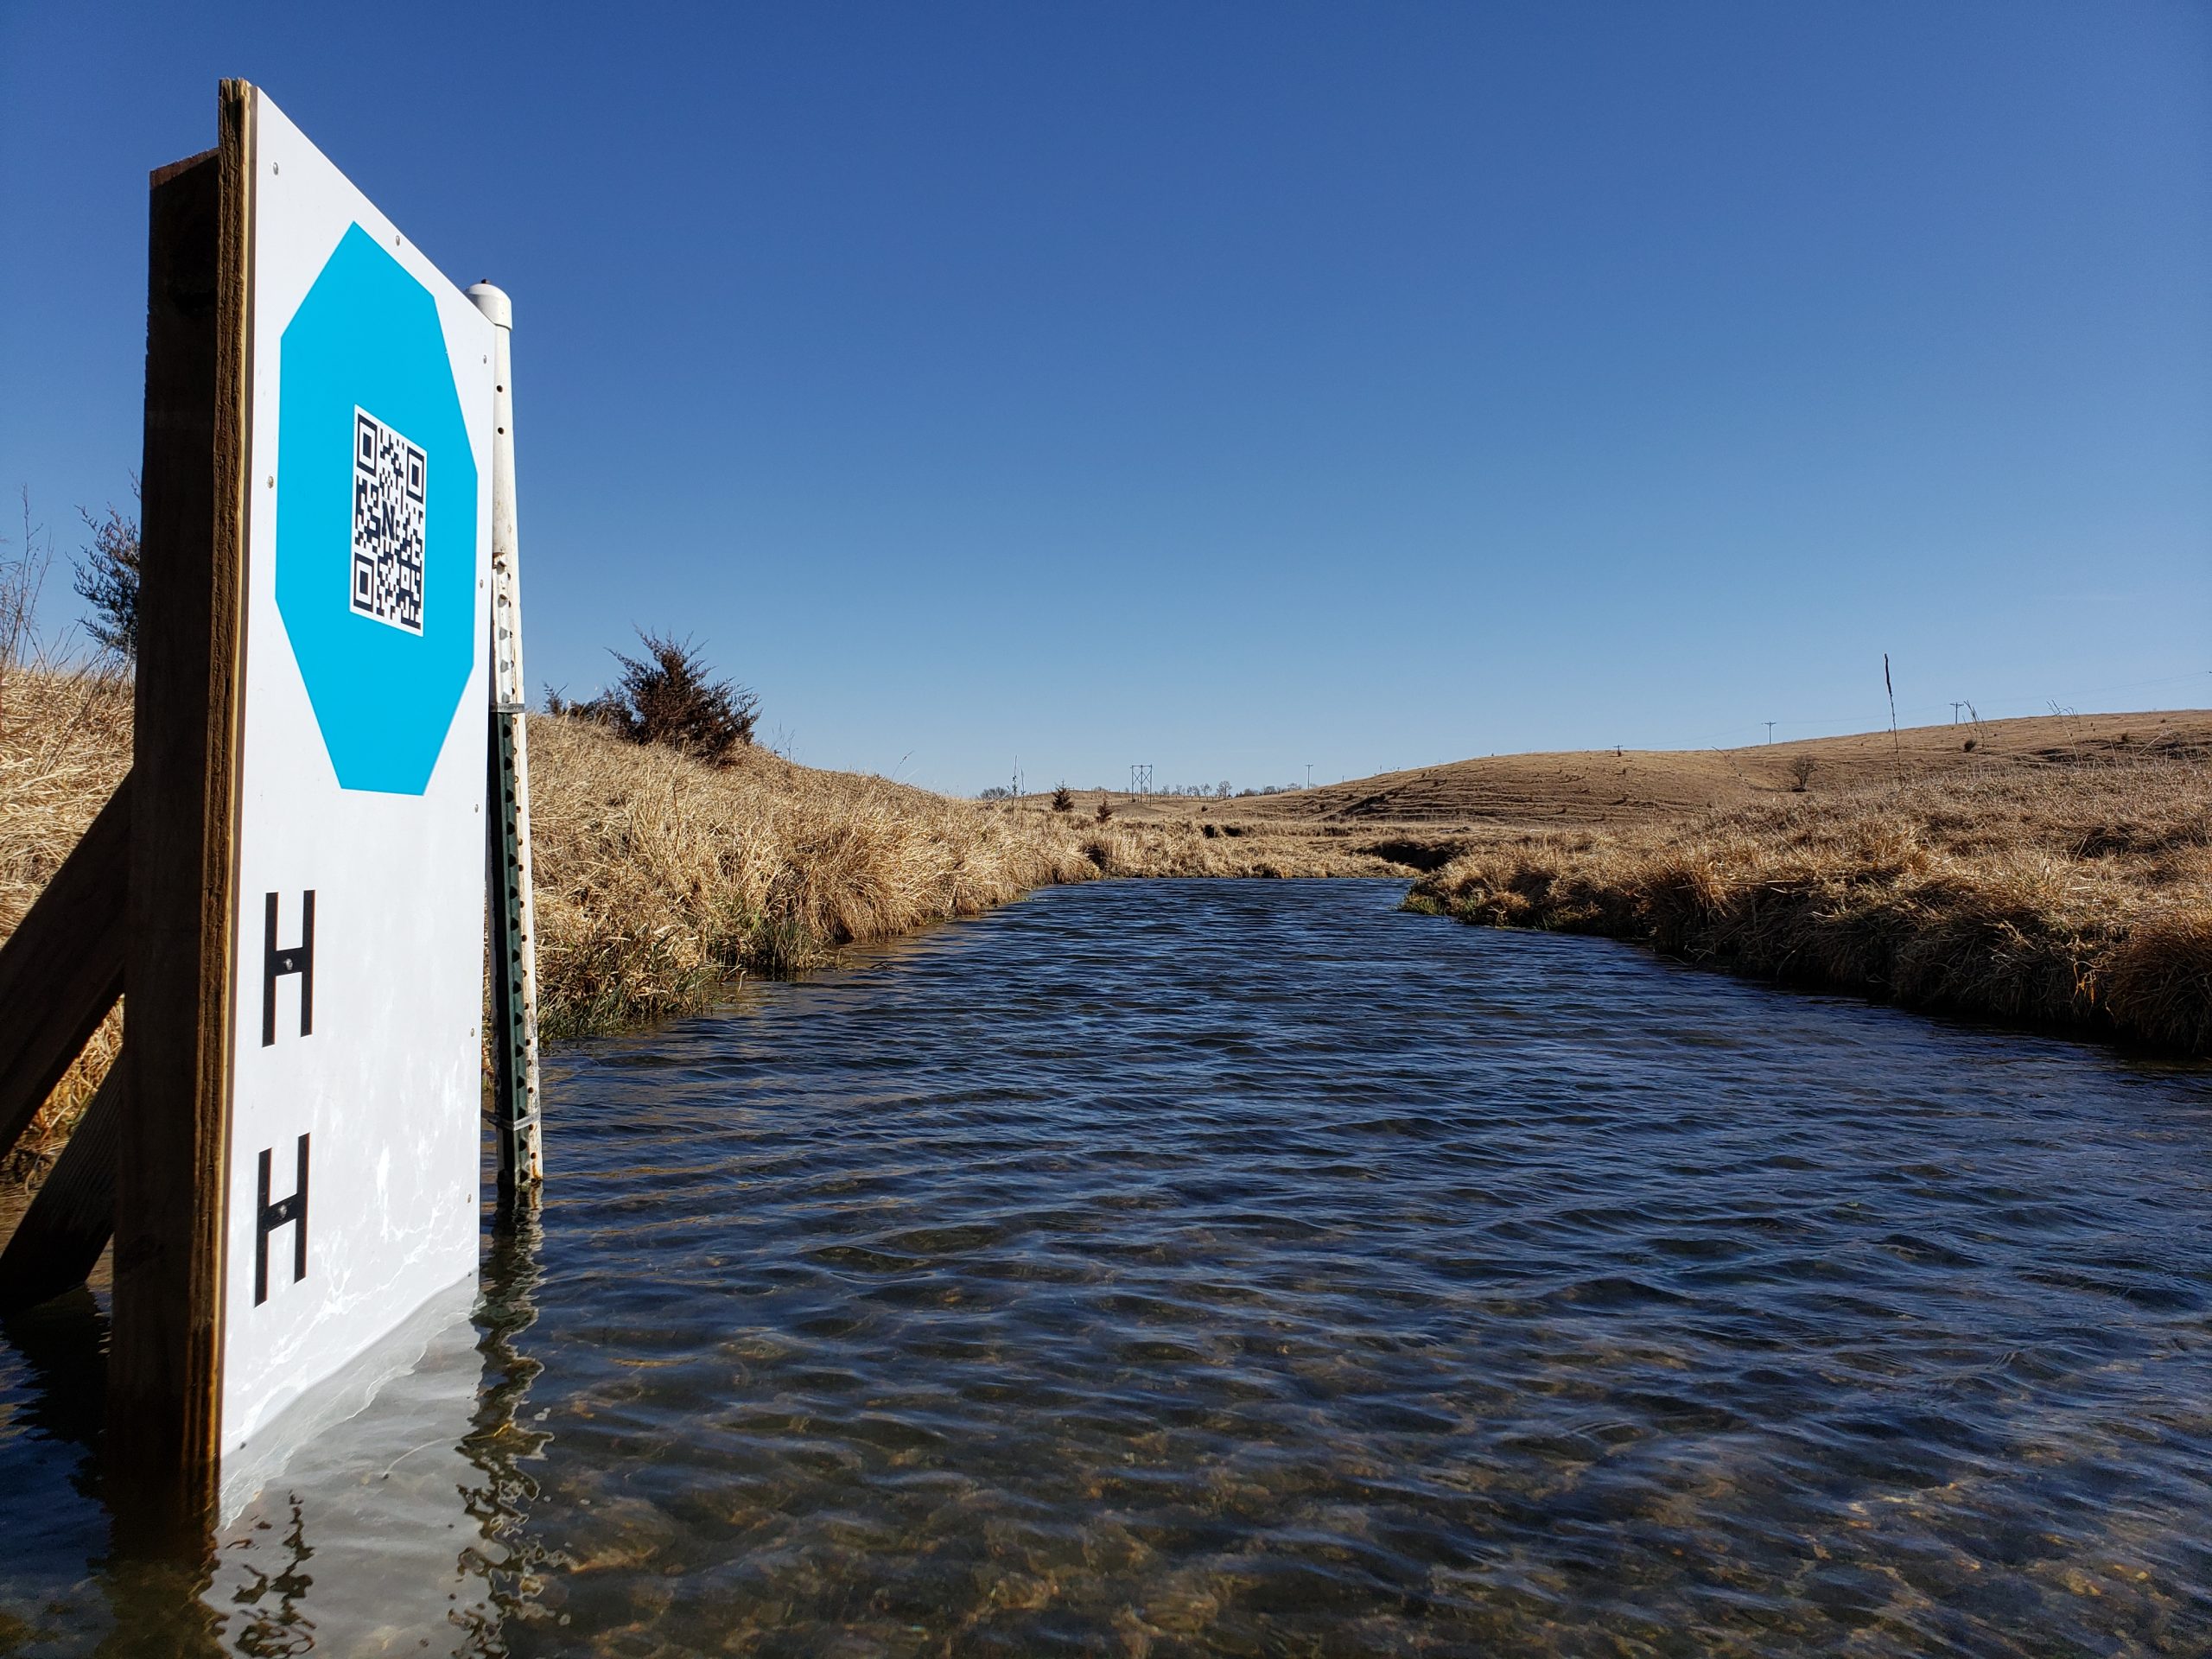
This post describes the first testing of a mini-octagon calibration target for measuring water level with a camera and machine vision algorithms.
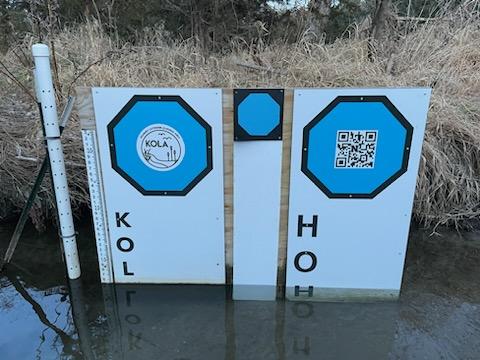
Mini-octagon (center) is approximately eight inches across, leading to a much smaller footprint for the target background. The other two octagons in the image are printed on plexiglass backgrounds two feet in width. Image credit: Mary Harner
The original GaugeCam “bow-tie” calibration target was about three feet wide and four feet tall. This target yielded excellent calibration and precise water level readings. However, the size of the target is obtrusive in images and prohibitive at some sites.
The next generation calibration target, the “octagon target,” is approximately two feet wide. The benefits of the octagon are that (1) the target footprint is much smaller, and (2) the calibration target remains above the water line, so a calibration can be performed for every image. Calibrating each image is more robust because it accounts for camera movement, which is inevitable. The large octagon target performs on par with the original bow-tie calibration target, as shown in Ken Chapman’s dissertation.
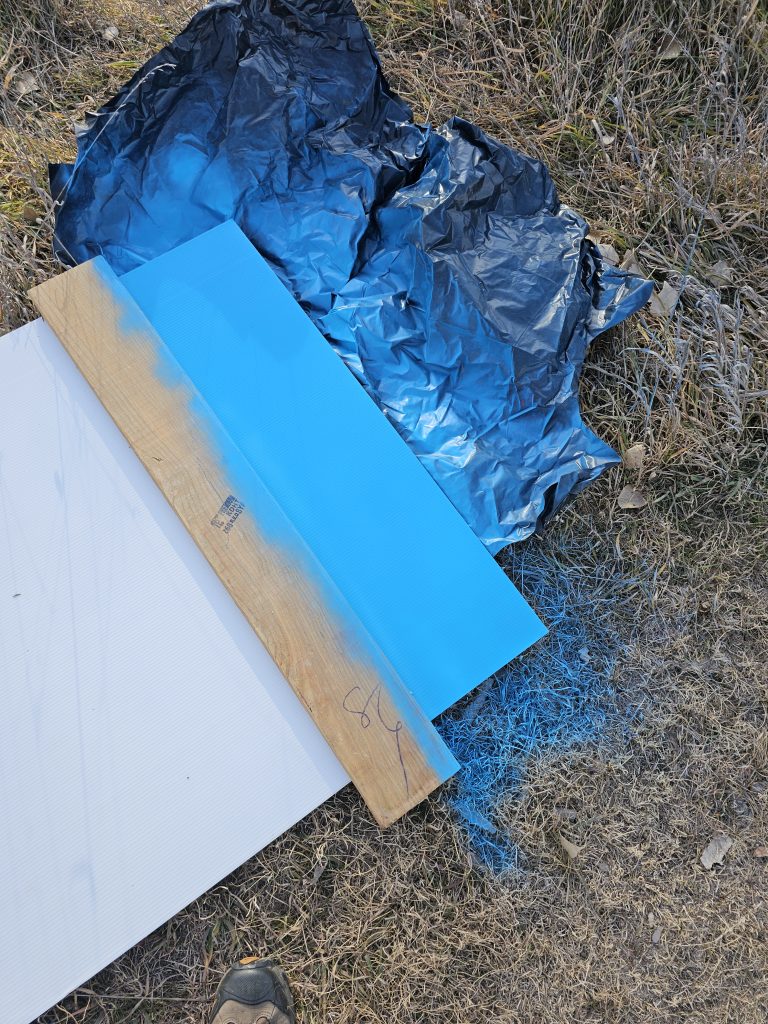
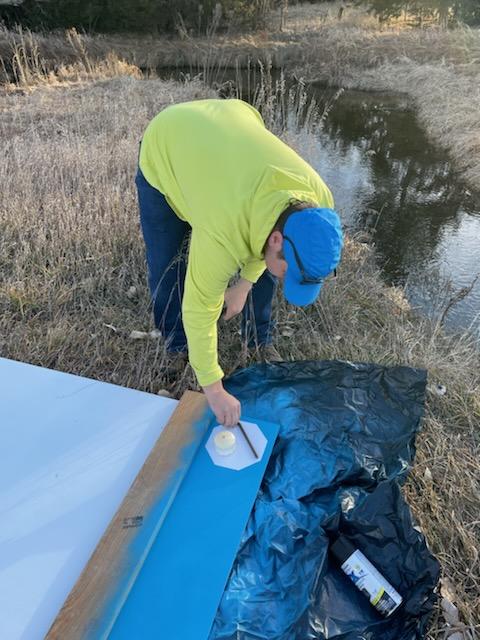
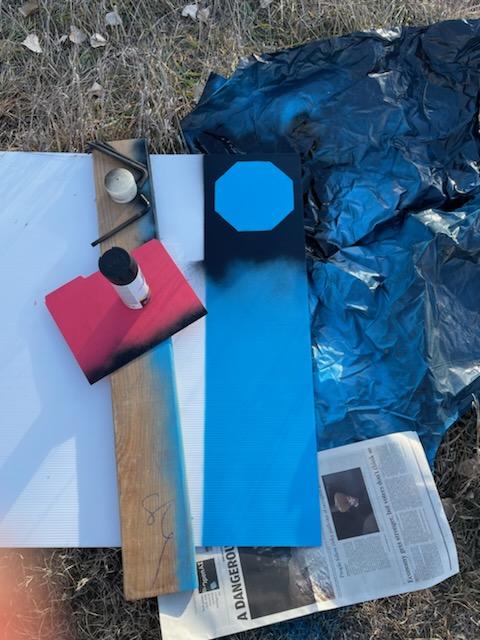
Our goal with the mini-octagon is to reduce the target background to the minimal size required for robust calibration and water level measurement. The current size is larger than a traditional staff gauge but reasonable size for installation in many environments. Below you can see our field fabrication of the first mini-octagon, using a sheet of Coroplast, spray paint, and octagon stencil.
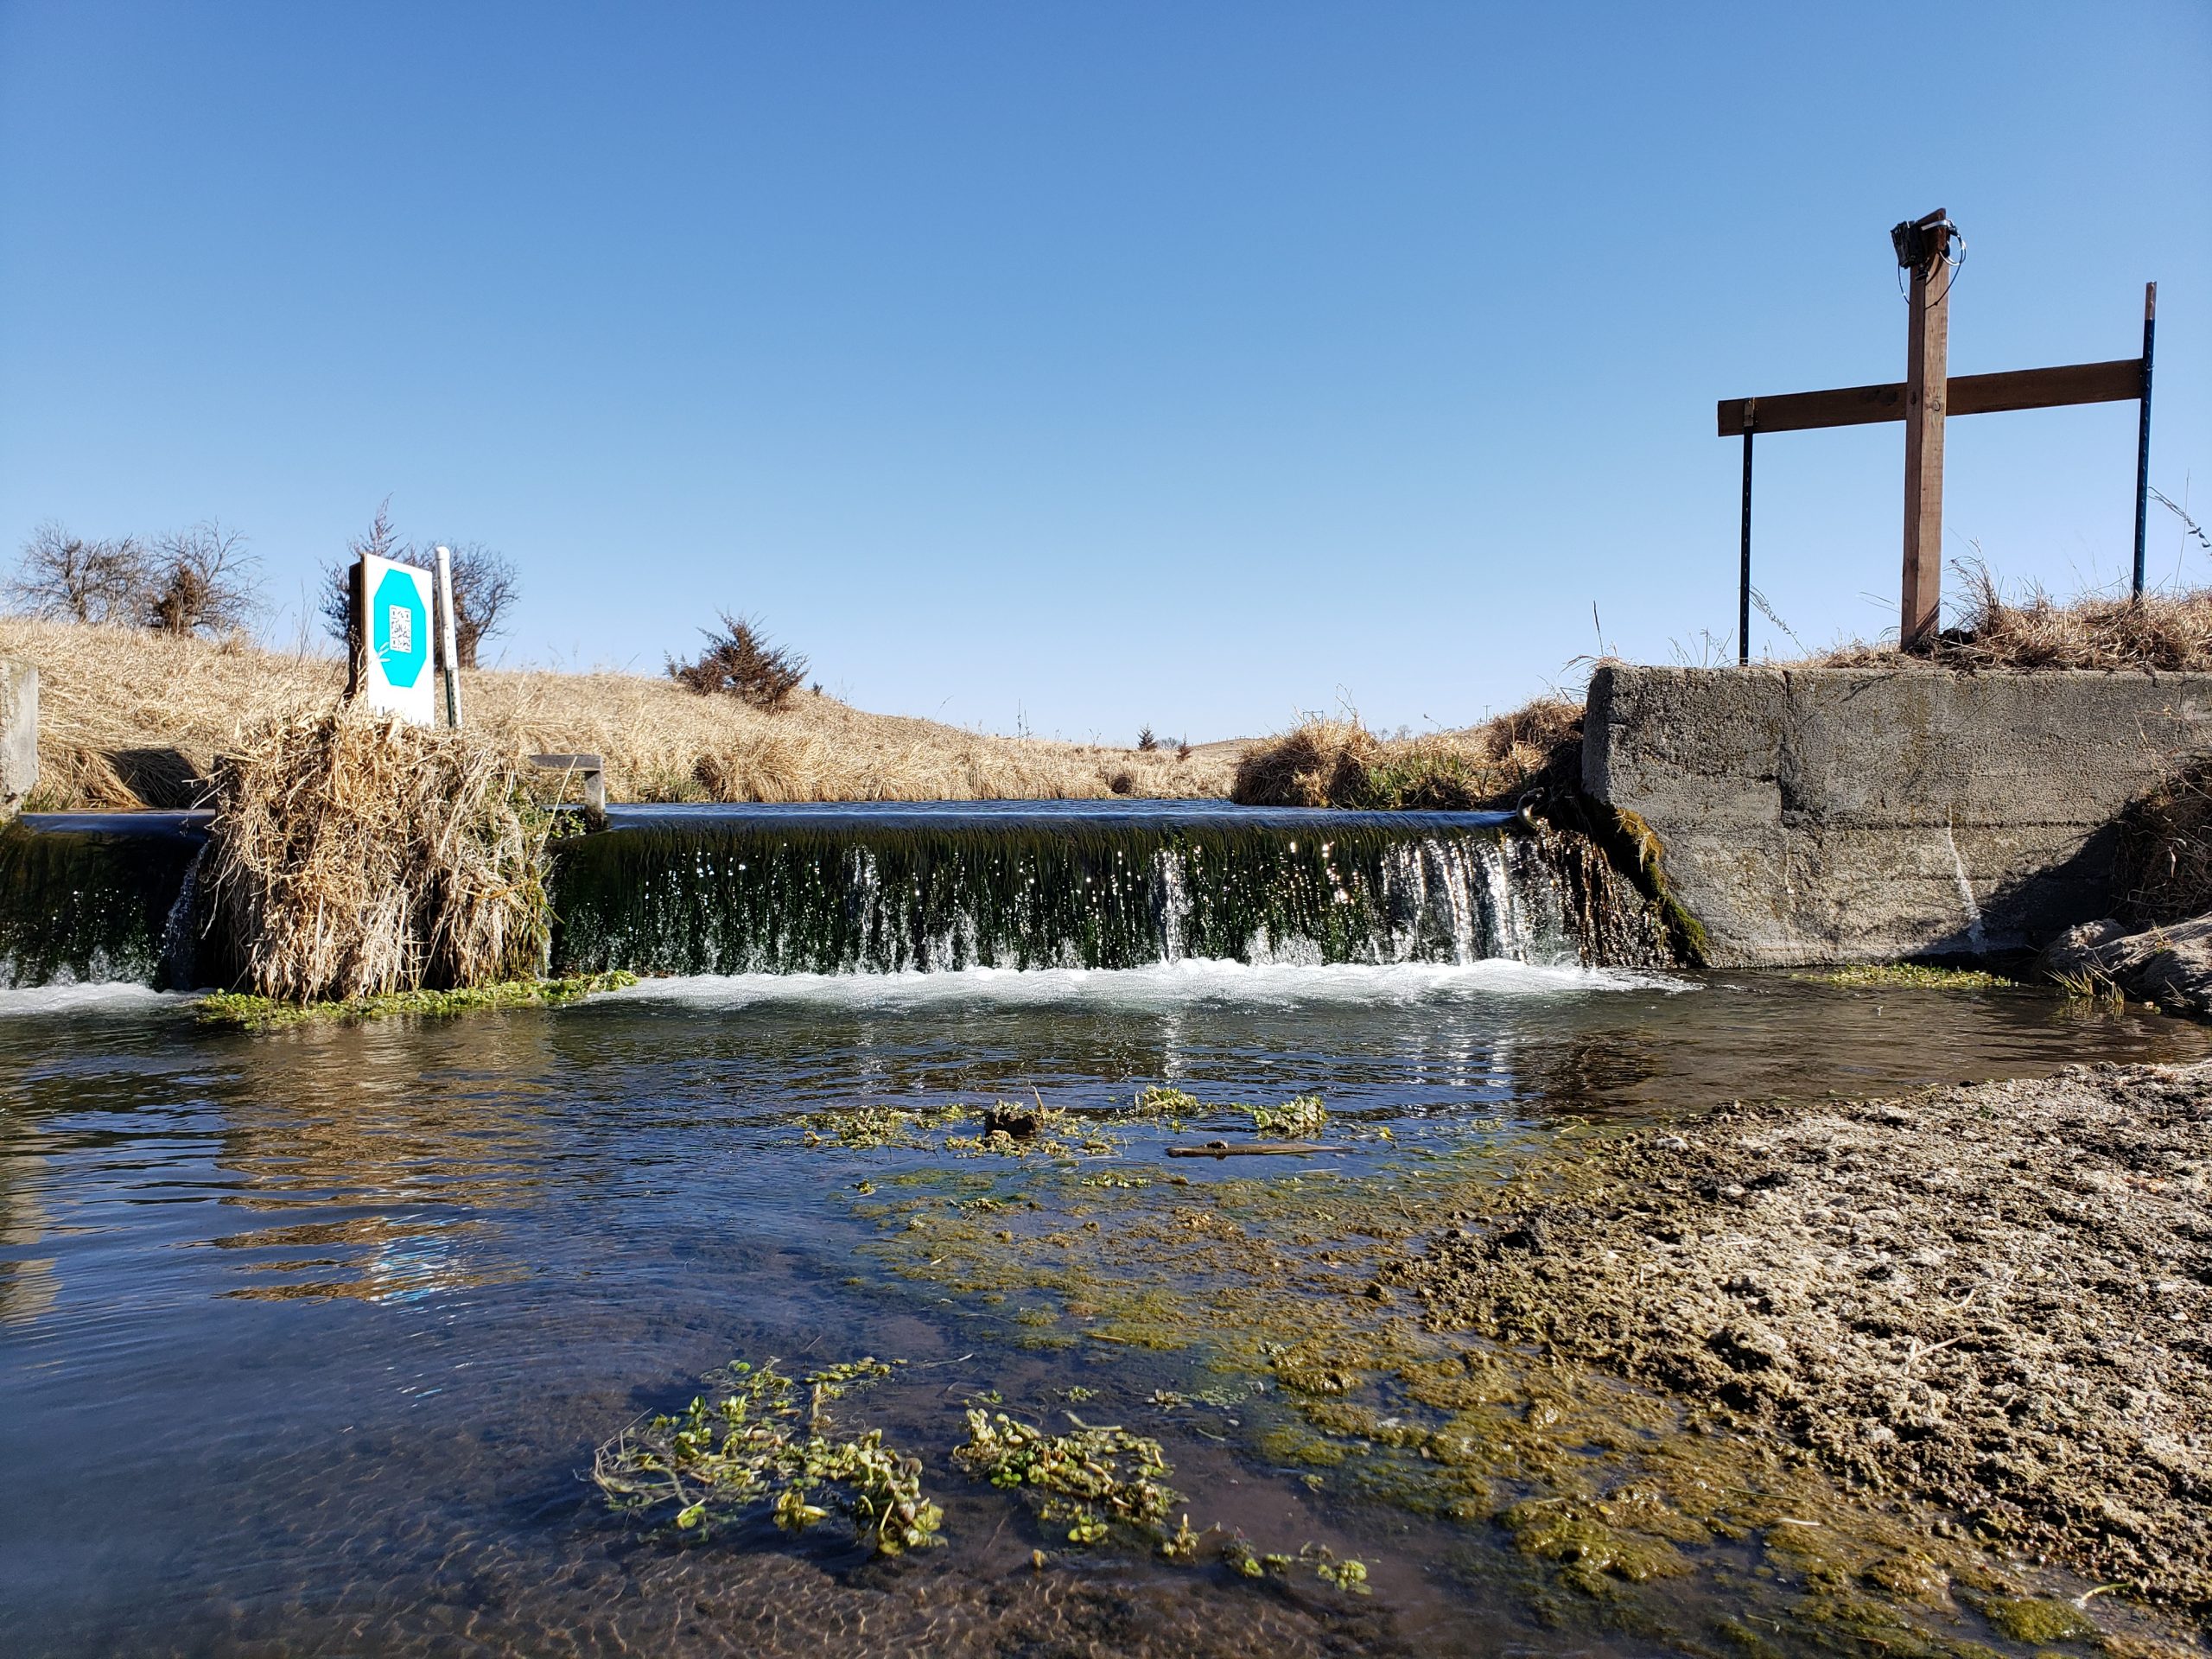
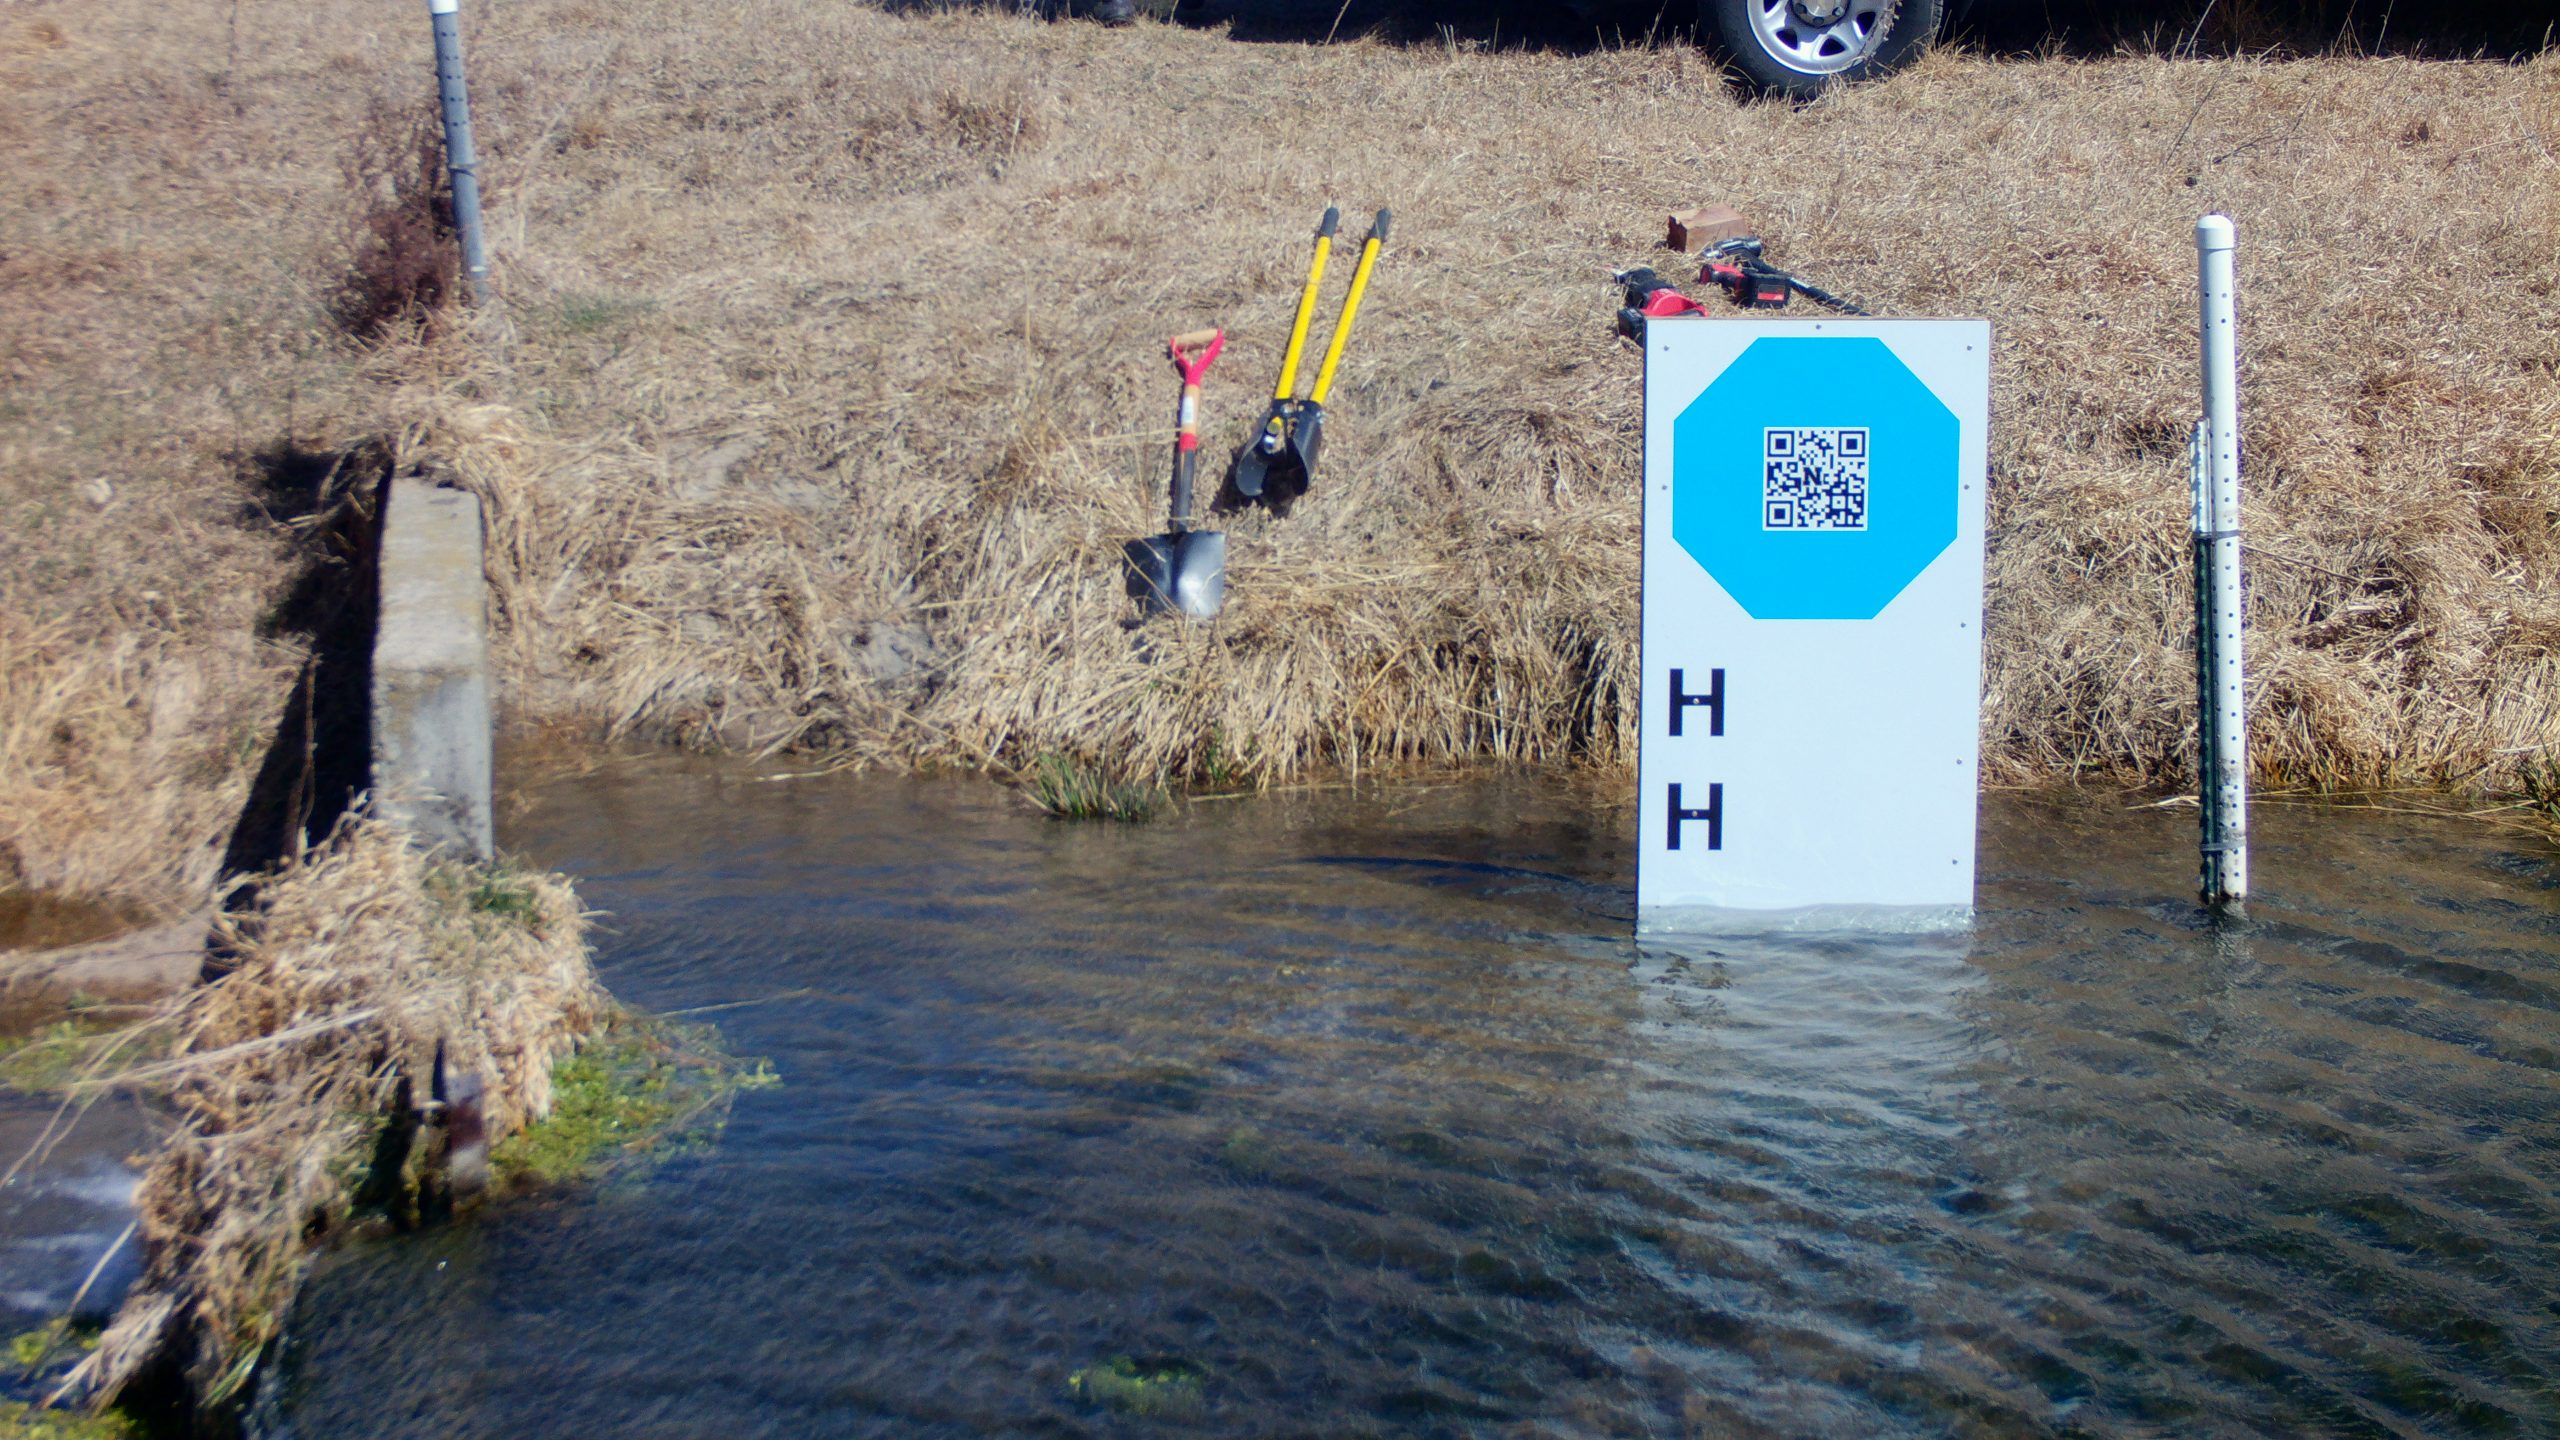
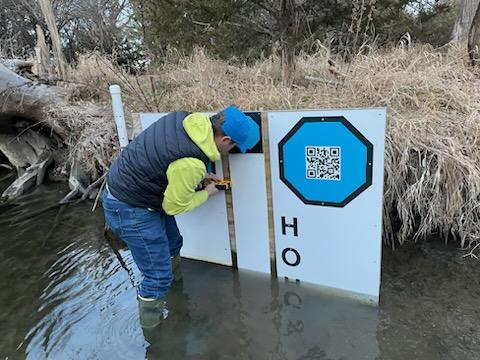
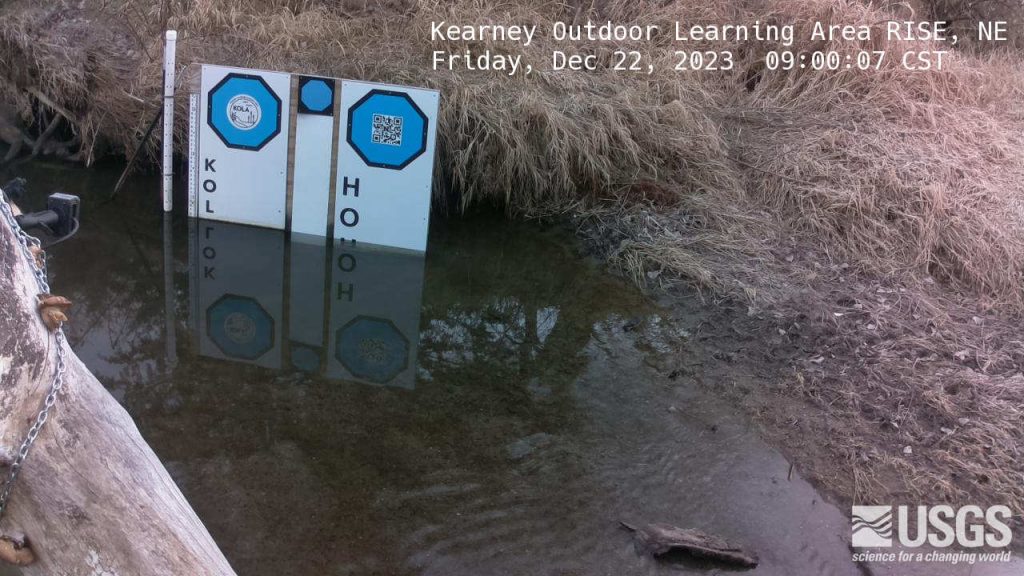
Test installation of the mini-octagon target at Kearney Outdoor Learning Area (KOLA). Photo Credit: Mary Harner
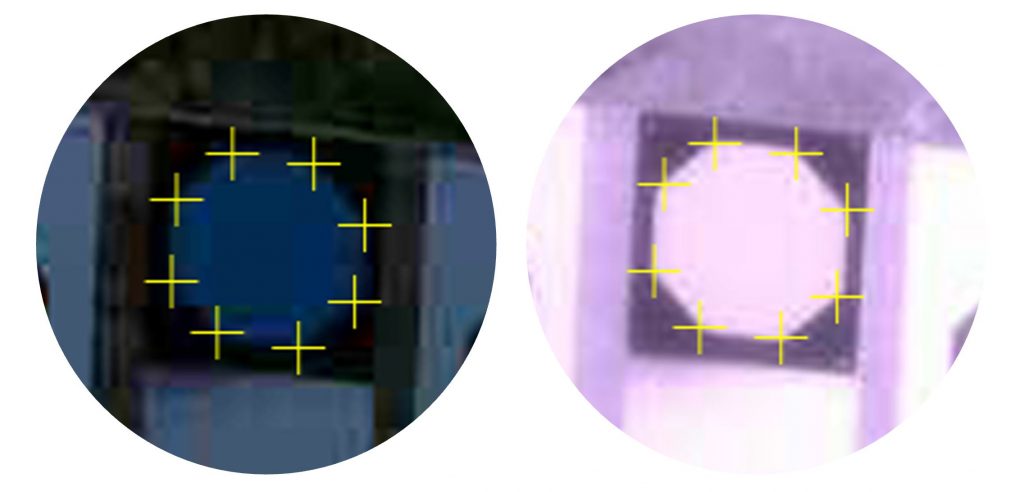
Initial tests show that our algorithms can detect the vertices of the mini-octagon in low-light conditions and under IR illumination.
Mini-octagon detection for image calibration. We are working to determine how much calibration precision is reduced by the smaller octagon.The latest KOLA imagery can be found at https://apps.usgs.gov/hivis/camera/NE_Kearney_Outdoor_Learning_Area_RISE.
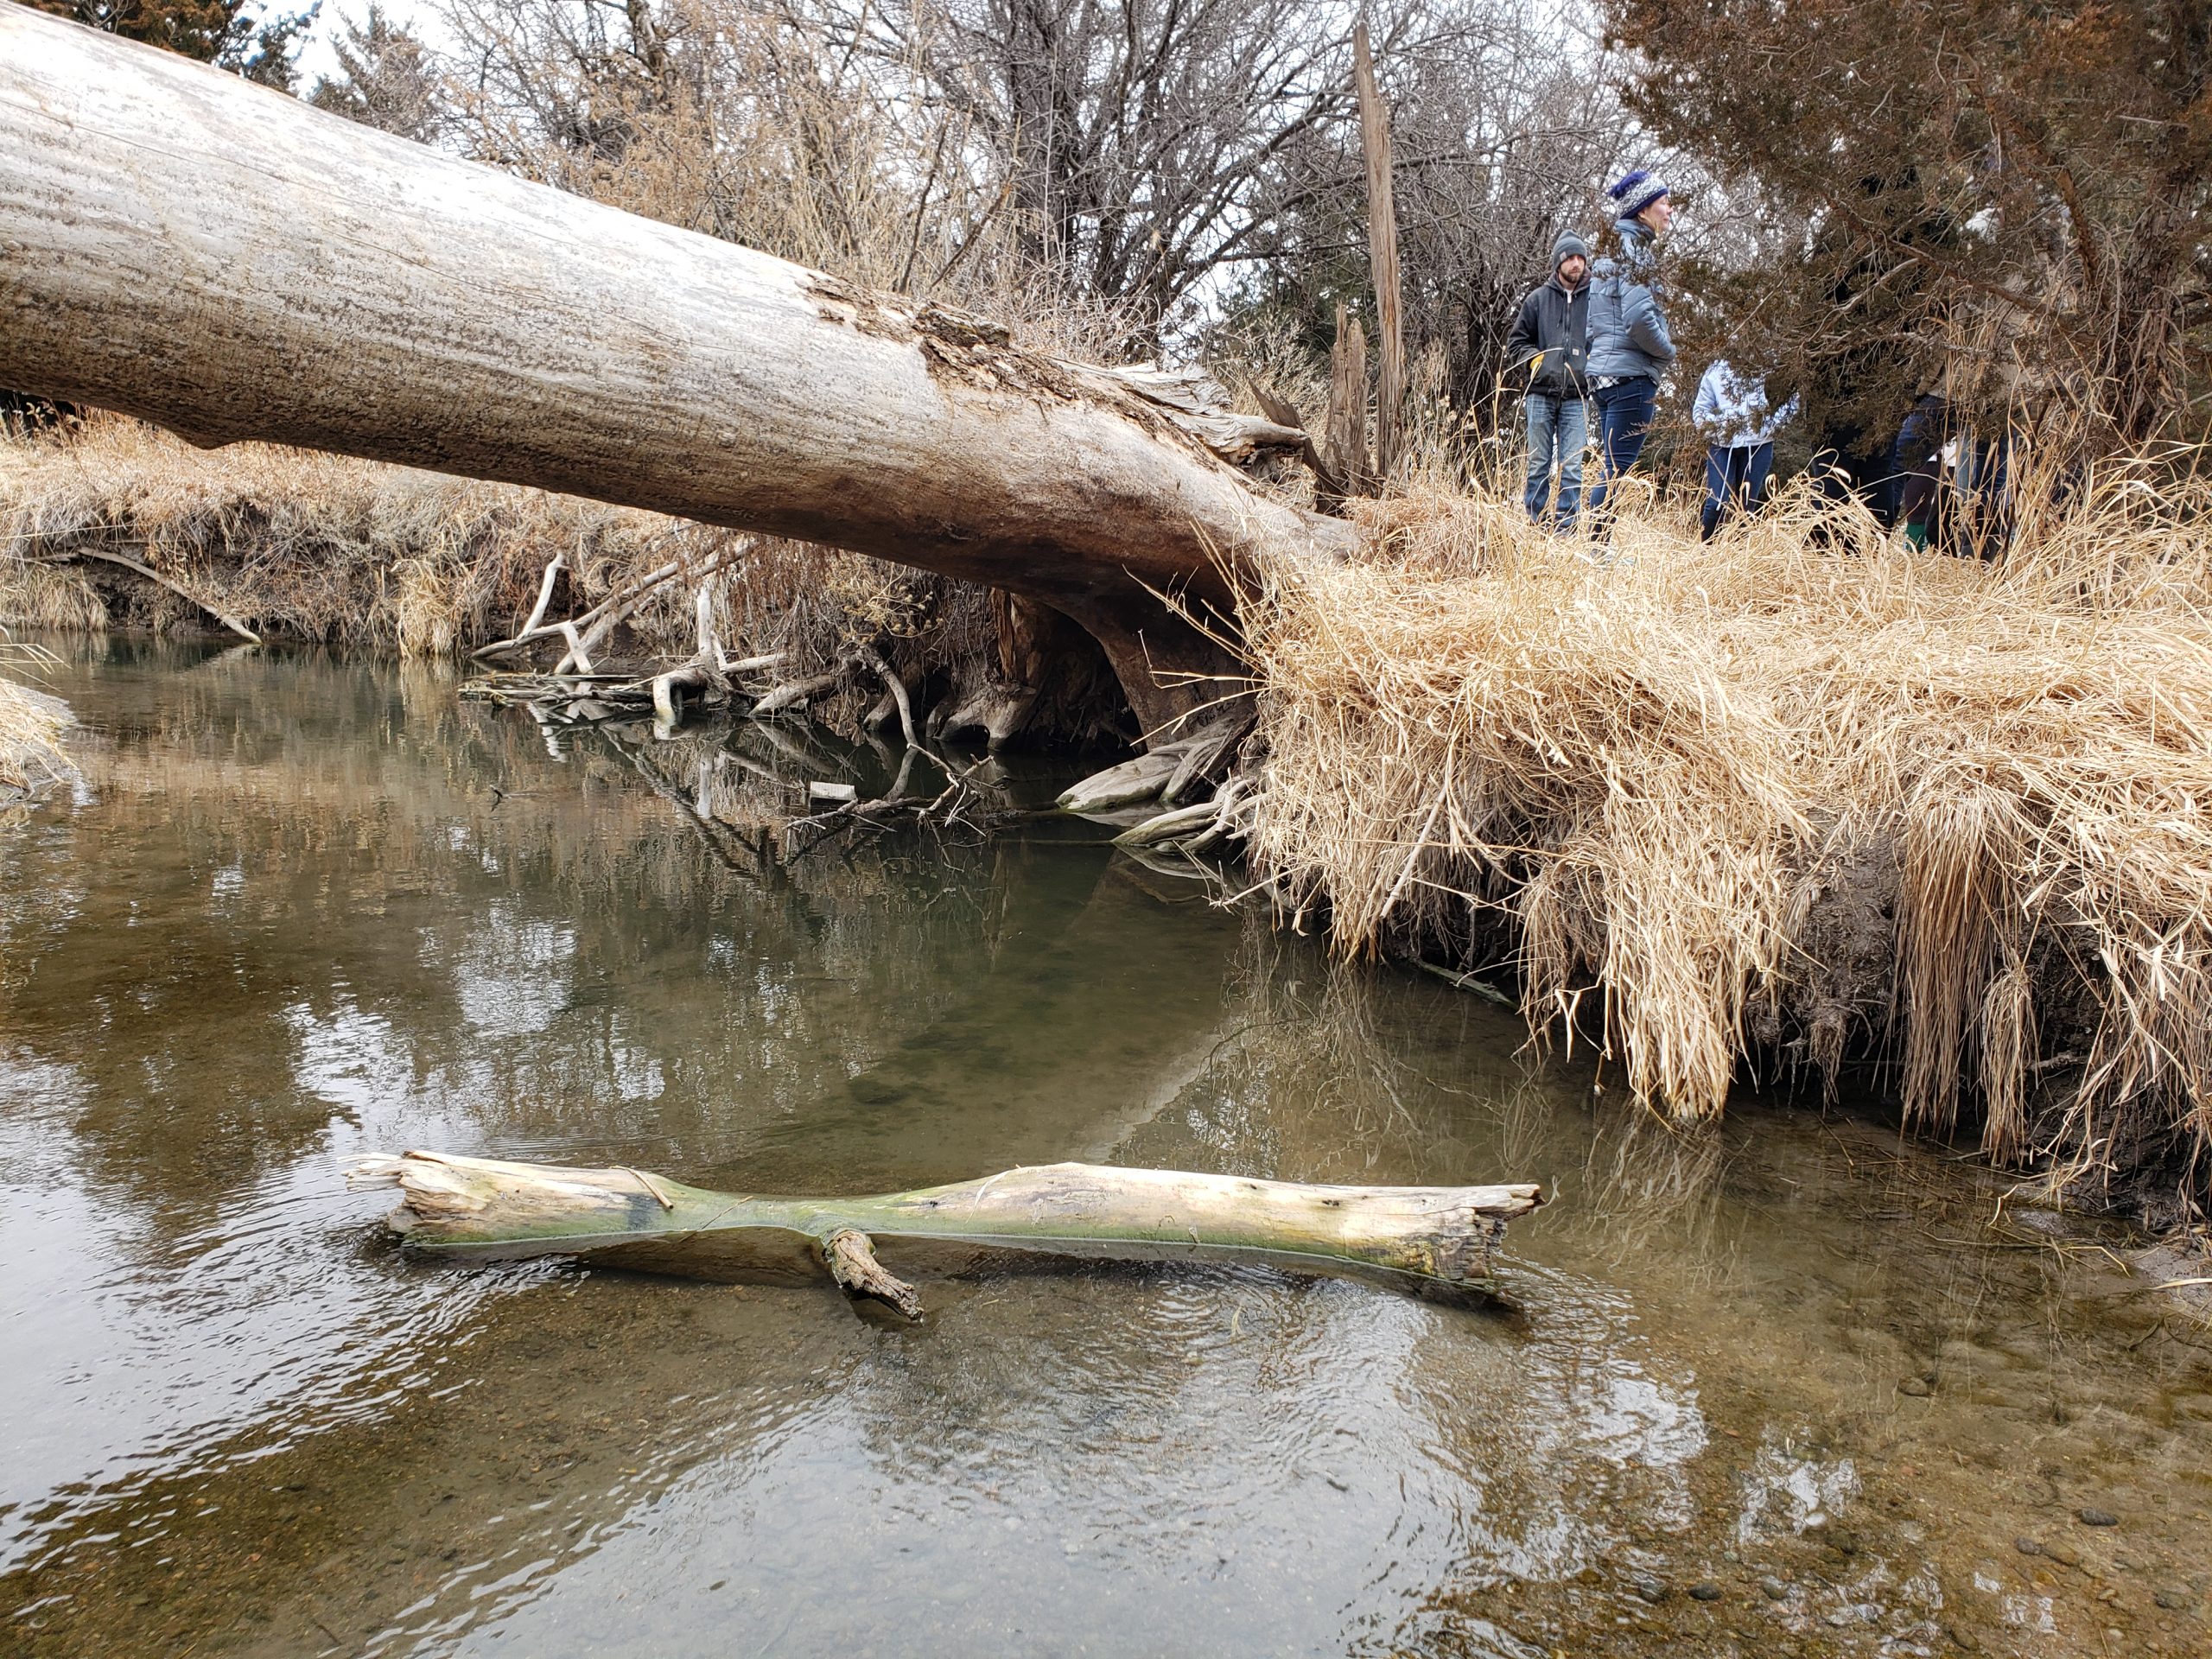
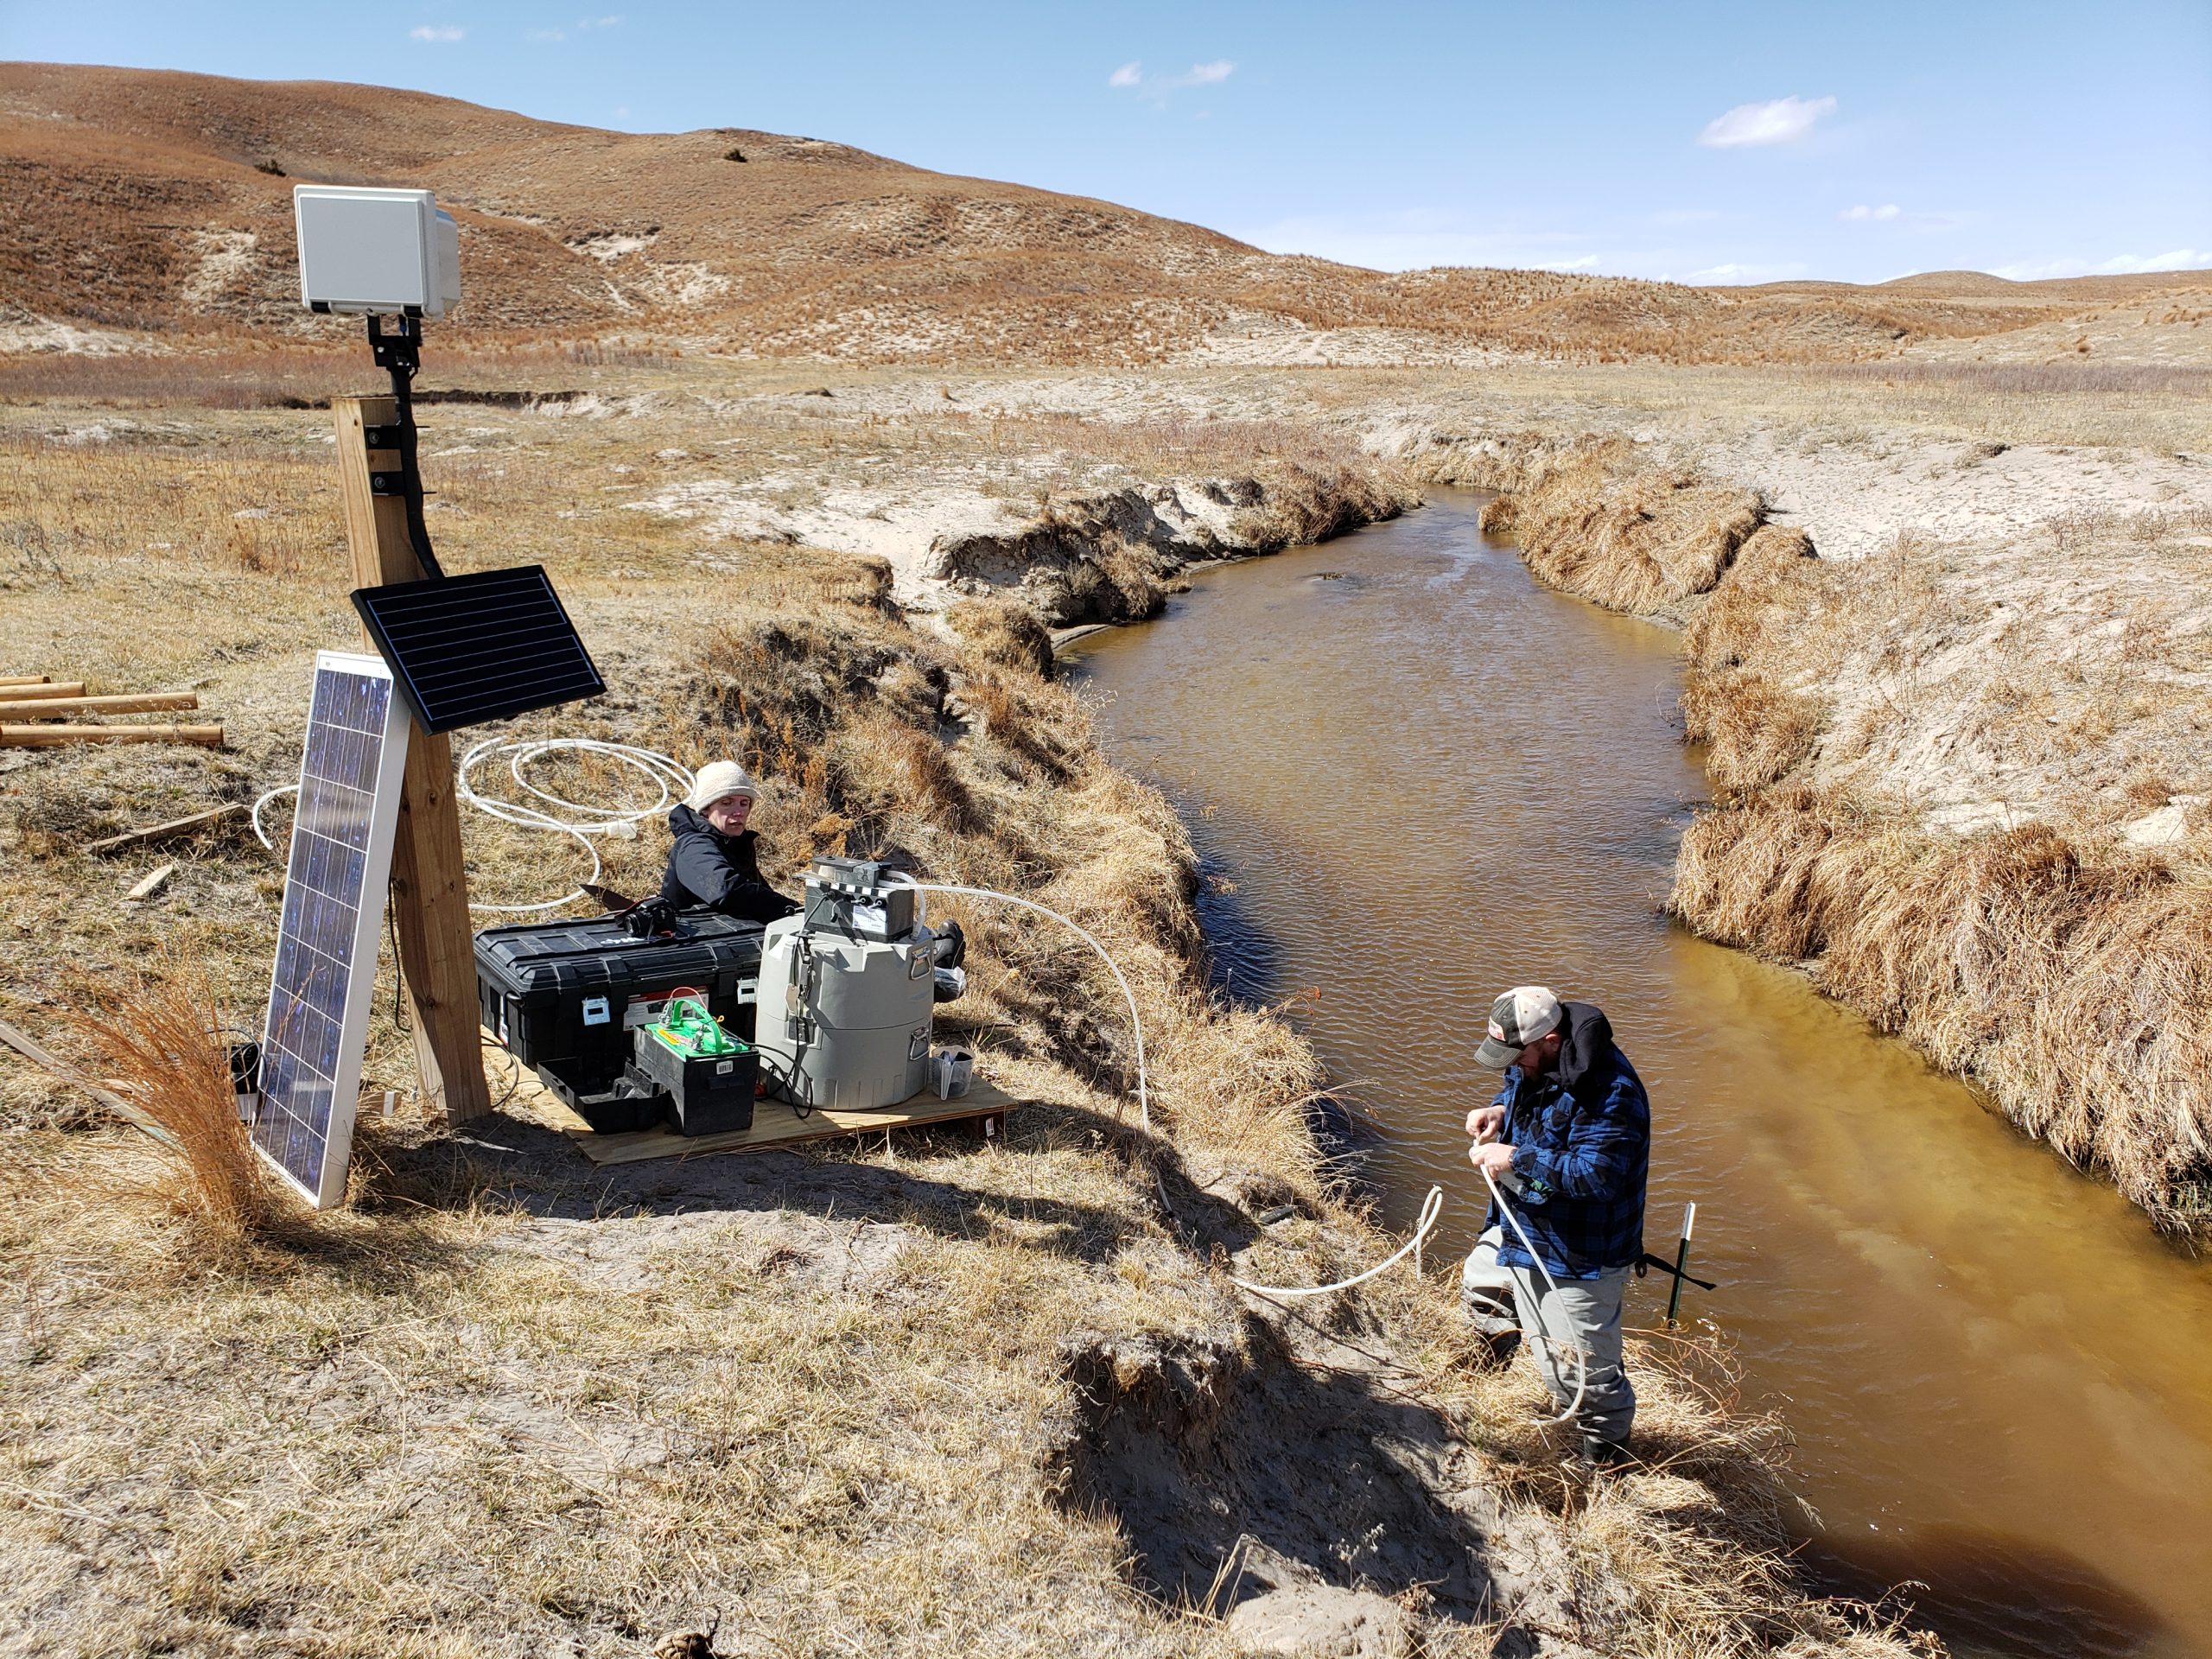
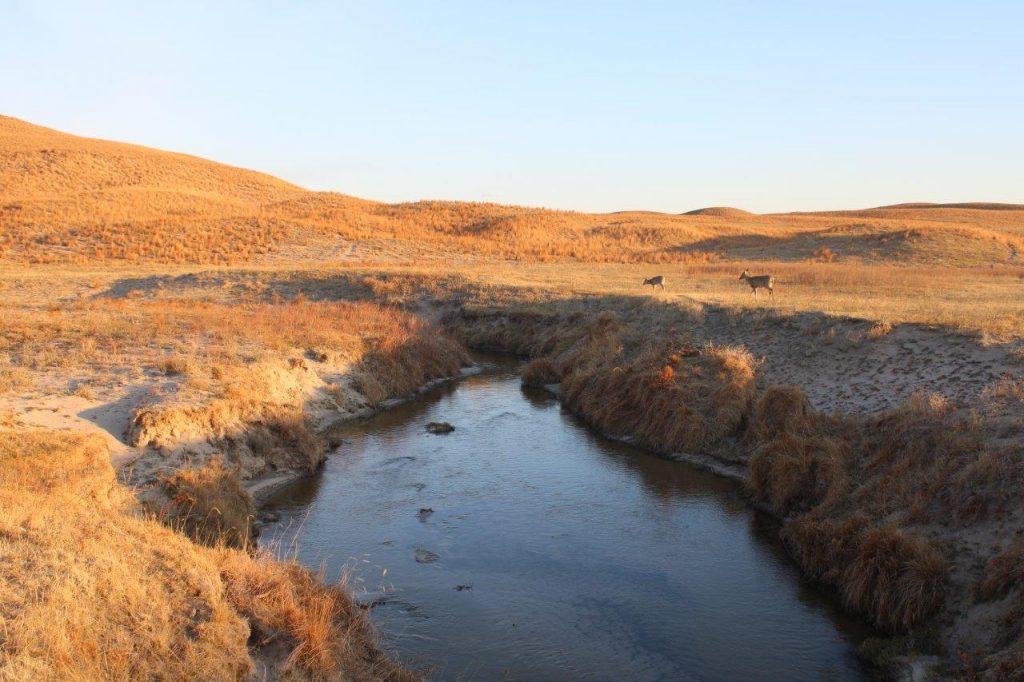
Photo credit: Mary Harner and Troy Gilmore, using a Platte Basin Timelapse (PBT) style camera on the South Branch Middle Loup River near Whitman, NE.
Updates
Congratulations to GRIME Lab team member Ken Chapman, who defended his dissertation and will graduate this month. Great job, Ken!
GRIME-related Proposals: two full proposals and a preproposal that involved GRIME software were submitted in November and December.
Check out the latest updates on our blog and let us know if/how we can support you project.
Software Information
What is GRIME?
GRIME (GaugeCam Remote Imagery Manager Educational) is open-source commercial-friendly software (Apache 2.0) that enables ecohydrological research using ground-based time-lapse imagery. The first GRIME software for measuring water level with cameras was developed in François Birgand’s lab at North Carolina State University.
What are GRIME2 and GRIME-AI?
GRIME2 and GRIME-AI are the two desktop applications developed by Ken Chapman and John Stranzl, respectively.
GRIME2 is software dedicated to quickly and easily measuring water level with time-lapse imagery. See more and download GRIME2 at https://gaugecam.org/grime2-details/.
Building on the successful WaterFront Software and KOLA Data Portal projects, we embarked on another student-led adventure in the Fall 2023 semester! Professor Elizabeth López Ramos connected the GRIME Lab team with an excellent student team at Tecnológico de Monterrey (ITESM). These students led the Data Fusion Project.
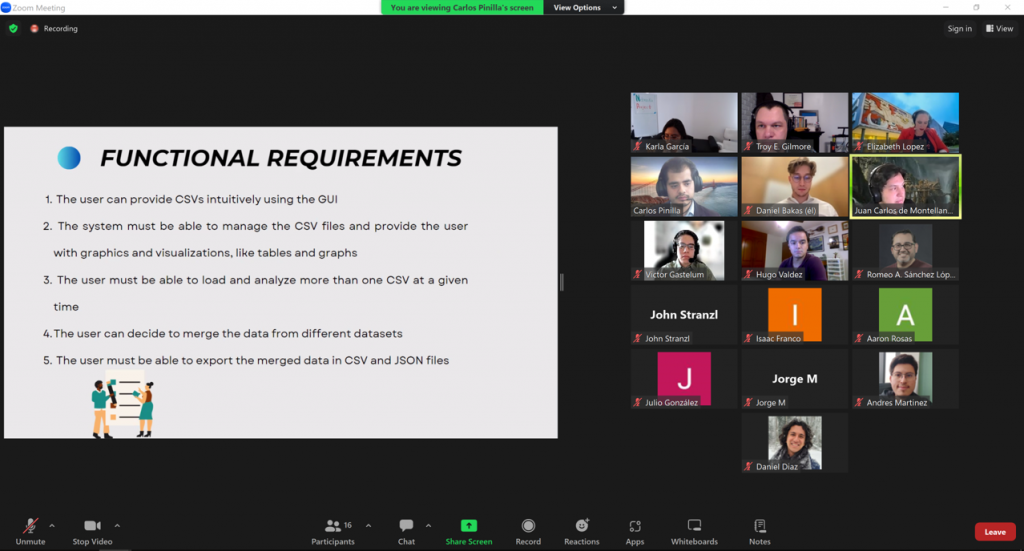
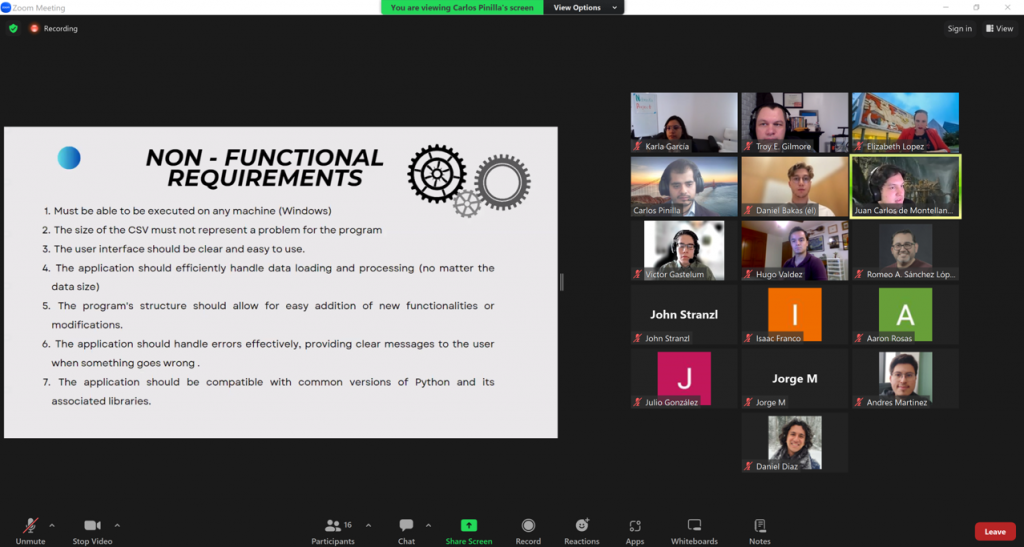
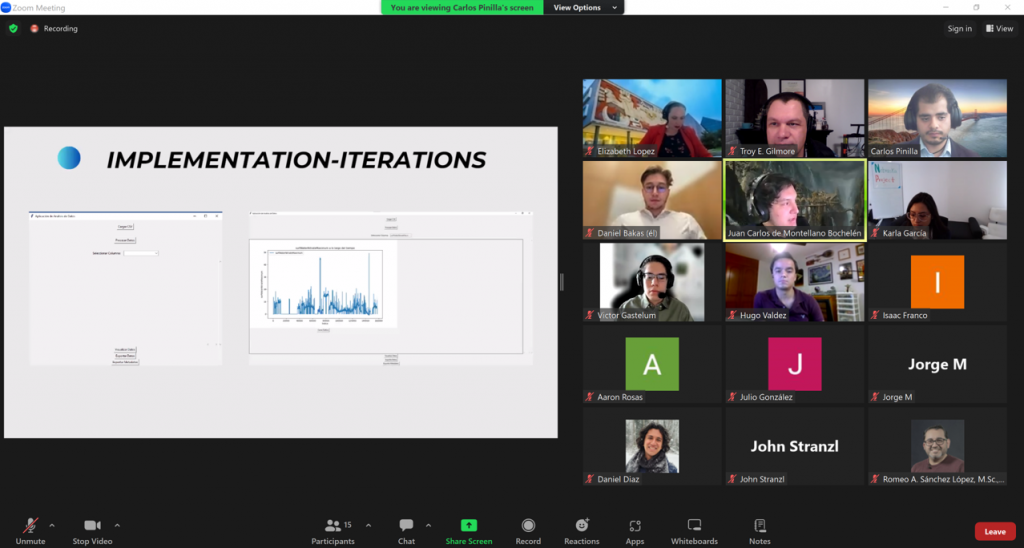
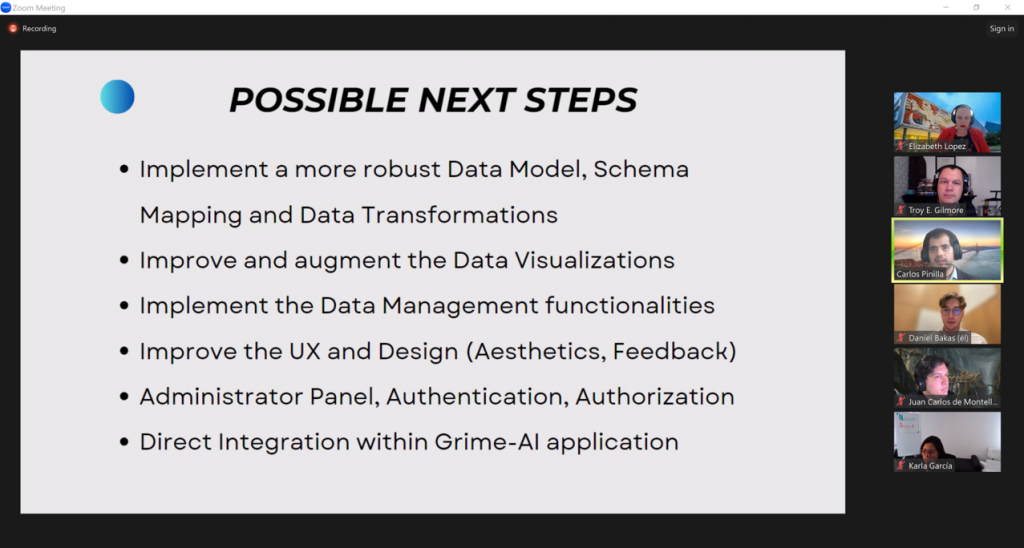
The Data Fusion Project is a first step toward integrating data fusion features in the GRIME-AI user interface. And the ITESM team dived DEEP into the software development life cycle on this one! As “clients” the GRIME Lab team had multiple meetings and filled out an extensive questionnaire. This made us really think through the requirements we desired. The ITESM team extensively documented this process, which is a major benefit to everyone going forward. Below are some screenshots from the ITESM team’s final presentation.
Functional requirements defined through client interviews, questionnaires and prototyping.Other requirements identified.Screenshot of live demo during the final presentation. The GUI was built using tkinter. CSV files can be loaded, data merged based on timestamps and data can be visualized.
The ITESM did a great job of working across campuses and completing a lot of behind-the-scenes work required to finish this project. Their project can be found on GitHub.
Overall, we are grateful for the opportunity to work with the ITESM Team. They were very professional and worked hard to create a viable product!
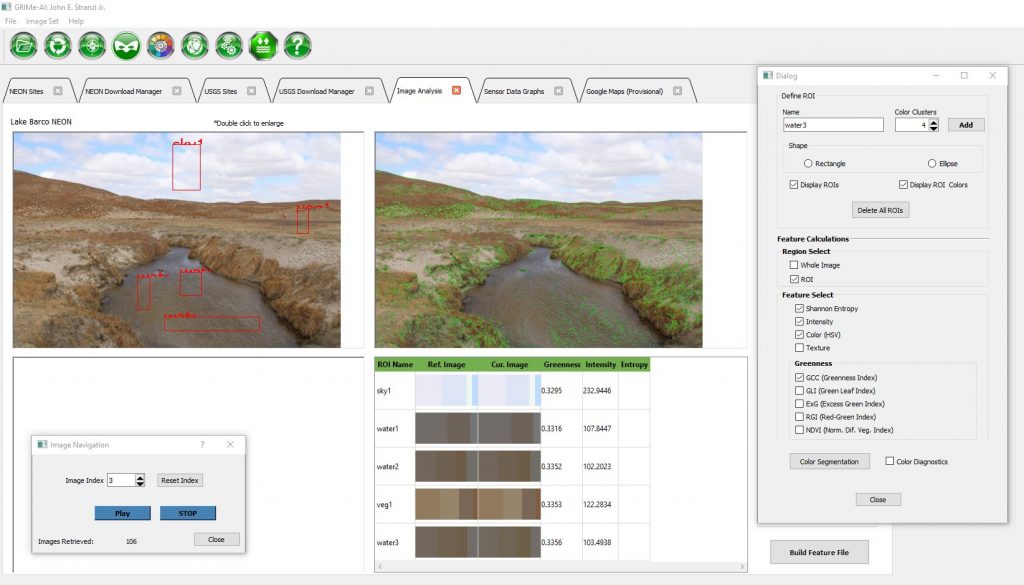
This video shows steps and time required for data download and image analysis of over 5,000 images from a USGS HIVIS site on the Elkhorn River in Nebraska. The process includes setting regions of interest (ROIs) and extraction of color and other scalar image features suitable for machine learning applications. This work was done on a laptop computer running GRIME-AI v0.0.3.8c-003.
PROCESSES COMPLETED:
• Data selection
• Imagery download
• Stage and discharge data download
• Image processing
• Image feature dataset created
• Ready for data fusion, then ML modeling
LAPTOP SPECIFICATIONS:
Intel i7-9850H @ 2.60GHz 2.59GHz
32 GB RAM
NVIDIA GeForce GTX 1650
Home fiber internet connection over Wifi
TIME REQUIRED:
The overall process took 1:04 hours, including all download and processing time. Extrapolating, this suggests about 4:15 hours required to download and process one year’s worth of imagery when working in my home office.
GRIME-AI Open-Source Software for Analysis of Ground-based TIme-lapse Imagery for Ecohydrological Science
This post builds on our recent update about GRIME-AI capabilities. The previous post (and video) described features in GRIME-AI that are reasonably stable (although subject to occasional changes in APIs for public data sources). The description below is our current roadmap to a full GRIME-AI suite of tools for using imagery in ecohydrological studies. Please contact us if you see major gaps or are interested in helping us test the software as new features are developed!
The following features are implemented or planned for GRIME-AI:
You will notice asterisks that indicate *planned future functionality (timeframe = months to years) and **functionality under development (timeframe = weeks to months). All other features are developed, but subject to additional user testing as we work toward a stable public release. GRIME-AI is being developed open source commercial friendly (Apache 2.0).
Acquire PhenoCam imagery and paired NEON sensor data
Acquire USGS HIVIS imagery and paired stage, discharge and other sensor data
Data cleaning (image triage)
Automatically identify and remove low-information imagery
Choose precision for “paired” timestamps (e.g., +/- 5 min between image timestamp and other sensor data timestamp)*
Image analysis
Calculate and export scalar features for ML with low computational requirements
Image analysis algorithms include:
K-means color clustering (user selected, up to 8 clusters, HSV for each cluster)
Greenness index (PhenoCam approach)
Shannon Entropy
Intensity
Texture
Draw masks for training segmentation models**
Draw polygon shapes
Save masks and overlay images**
Export mask**
Image calibration and deterministic water level detection (currently a separate Windows installer called GRIME2, but we have command line to implement this in GRIME-AI)**
Draw calibration ROI for automatic detection of octagon calibration targets
Draw edge detection ROI for automatic detection of water edge
Enter reference water level and octagon facet length
Process image folders
Save overlay images
All scalar feature values, ROIs and polygon shapes exported as .csv and .json*
Data products and export*
Documentation of data source and user decisions, where final datasets include:
Metadata for all source data*
Documented user decisions from data cleaning and data fusion processes*
Documentation of calculated image features*
Sample image overlay showing location of ROIs*
Sample image showing segmentation masks and labels*
Coordinates and labels of all ROIs (.csv and .json)*
Breakpoints for major camera movement, image stabilization, or other major changes in imagery*
A .csv and a .json file with aligned, tidy data that is appropriate for training/testing ML models*
Metadata appropriate for storing final data product (scalar data only) in CUAHSI HydroShare or similar data repository*
Documentation of imagery source, including timestamps and metadata for original imagery retrieved from public archive*
Modeling and model outputs*
Build segmentation models (e.g., to automatically detect water surfaces in images)*
Build ML models from scalar image features and other sensor data and/or segmentation results*
Export model results, performance metrics, and metadata*
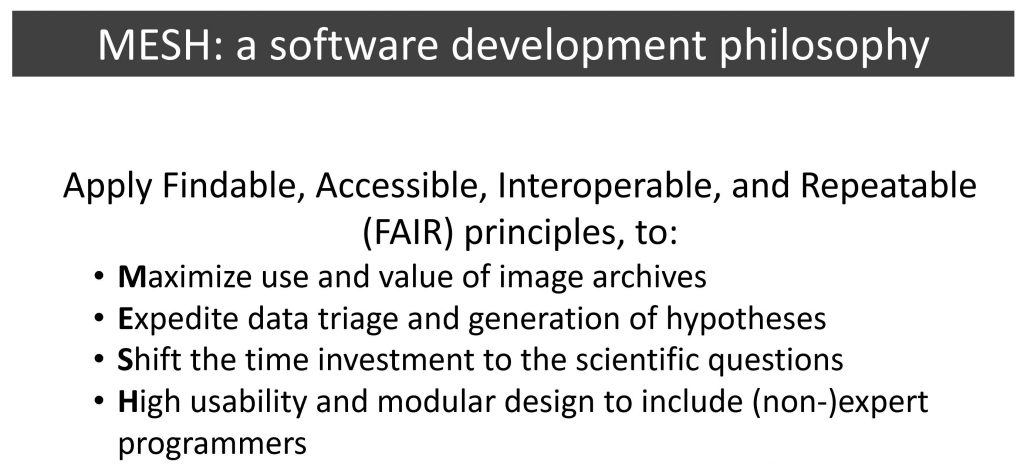
All of the above are being developed under the MESH development philosophy:
John Stranzl has been continuously adding features to GRIME-AI, which is open-source software for acquiring data and processing imagery from ground-based cameras.
Here’s a quick update on the current capabilities of GRIME-A v0.0.3.3. This video features:
Downloader for PhenoCam imagery and other data at NEON sites
Downloader for USGS Imagery and paired stage and discharge data
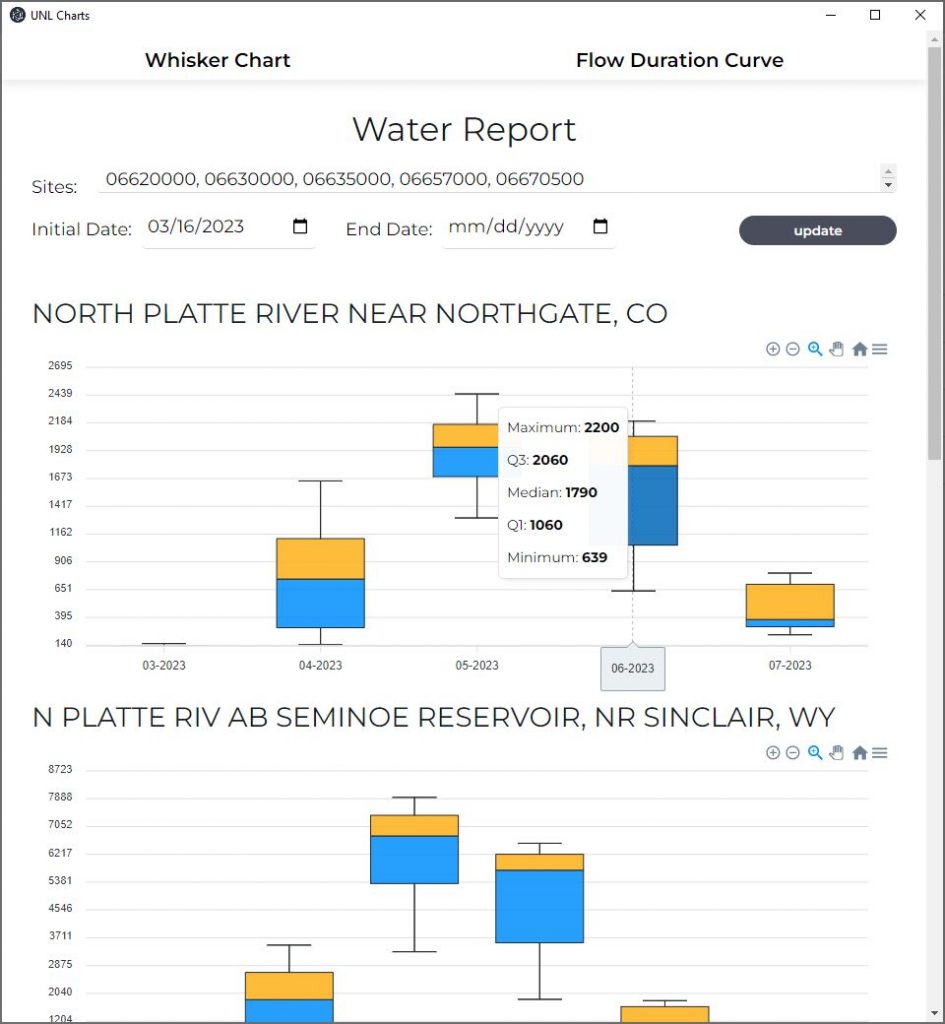
Hydrologists are used to jumping through hoops to access data. But it doesn’t have to be that way all the time! In a single semester, the stellar Tecnológico de Monterrey (ITESM) WaterFront Project Team developed software that will easily display monthly summaries of streamflow at multiple USGS stream gages. As a bonus, we can quickly view flow duration curves for the same gages.
Thanks to the ITESM team’s expertise and hard work, this software will be used to generate Extension hydrology reports for the Platte River in Nebraska. Platte River streamflows are critical for agricultural production and for important wildlife habitat in Nebraska.
The UNL GaugeCam Team, along with Doug Hallum at the West Central Research, Education and Extension Center, presented this challenge to the capstone student group in the Departamento de Computación and Escuela de Ingeniería y Ciencias. ITESM students, led by Professor Elizabeth López Ramos, tackled this project in two phases.
PHASE 1: Gather list of client requirements and develop proposal.
Requirement gathering and analysis based on meetings with client.
Research and brainstorm to devise innovative and practical solutions.
Create a concise proposal outlining solutions, timeline, budget, and benefits for the client.
Present refined proposal to the client, highlighting alignment with requirements and receiving feedback.
PHASE 2: Build out the software based on the accepted proposal.
Construct platform, including features and functionality described in the proposal.
Test software functionality, performance, and security to meet client requirements and industry standards.
Present the software to the client for feedback and iterate to meet expectations and requirements.
Just like real world situations, we (UNL) came into this project with many ideas for the team. In other words, we gave them the very real challenge of (1) setting realistic expectations for the client, and (2) helping the client know what they actually want for a final product. And what we got was a streamlined, professional Windows application and good documentation.
Check out the animation below to see some of the WaterFront features.
Select a range of months to summarize
Display monthly statistics by hovering mouse
Display additional USGS gage sites
Show flow-duration curves
Download graphics and data
We are truly grateful to the ITESM WaterFront Team for their dedication to this project.
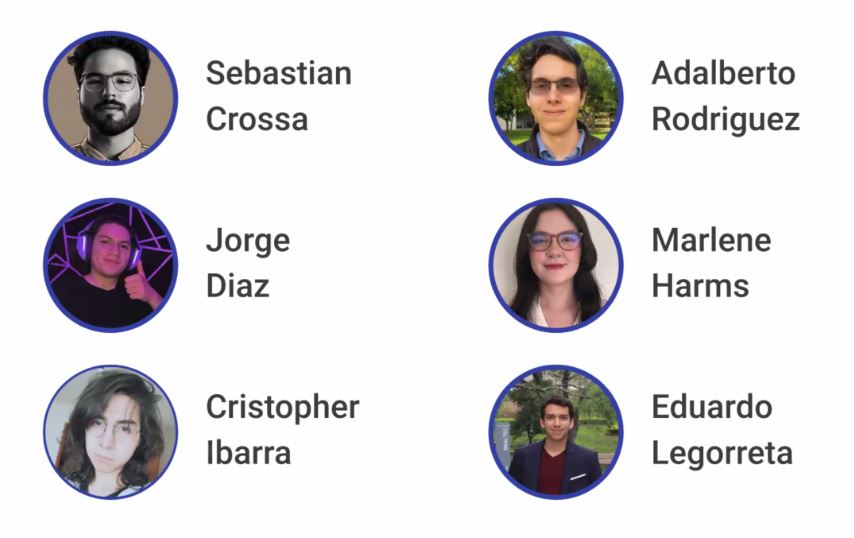
Joel Fernando Santillán Santana
Jorge Luis Salgado Ledezma
Milton Eduardo Barroso Ramírez
Miriam Paulina Palomera Curiel
José Ricardo Vanegas Castillo
Special thanks also to Professor Elizabeth López Ramos and Professor Gildardo Sánchez Ante for a wonderful experience working with your class. We hope we can continue working together!
In Spring 2023 the GaugeCam team at the University of Nebraska worked with two excellent student groups on their capstone projects in the Departamento de Computación and Escuela de Ingeniería y Ciencias at Tecnológico de Monterrey (ITESM).
The first group we are featuring is the KOLA Data Portal Team. These students did an amazing job creating a web interface for multimodal environmental data! Professor Elizabeth López Ramos was the instructor for this capstone course.
This project was focused on creating a data portal for the Kearney Outdoor Learning Area (KOLA) site that is located next to the Kearney, NE High School. The project was designed to simulate real interaction with clients and included two phases.
PHASE 1: Gather list of client requirements and develop proposal.
Requirement gathering and analysis based on meetings with client.
Research and brainstorm to devise innovative and practical solutions.
Create a concise proposal outlining solutions, timeline, budget, and benefits for the client.
Present refined proposal to the client, highlighting alignment with requirements and receiving feedback.
PHASE 2: Build out the data ingestion platform based on the accepted proposal.
Construct platform, including features and functionality described in the proposal.
Test platform functionality, performance, and security to meet client requirements and industry standards.
Present the platform to the client for feedback and iterate to meet expectations and requirements.
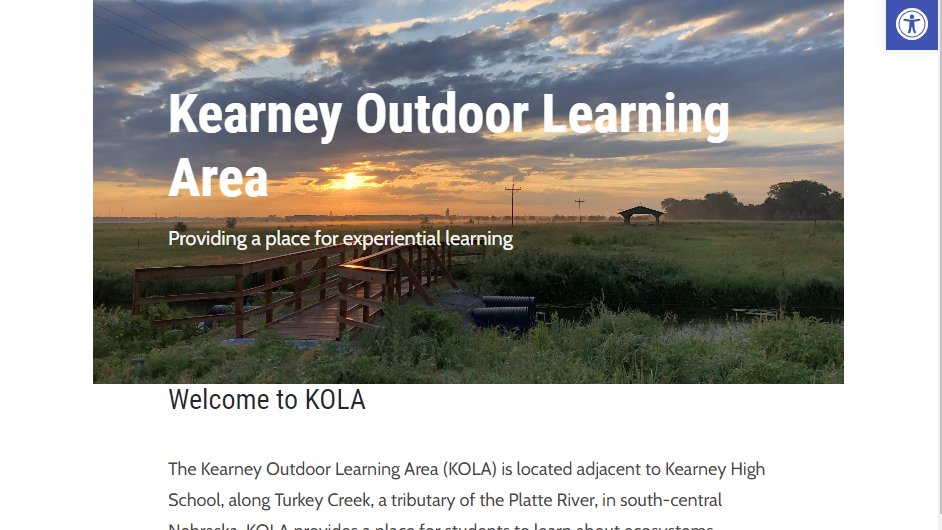
A view and description of KOLA can be seen in the screenshot below.
A view of KOLA courtesy of https://outdoorclassne.com.
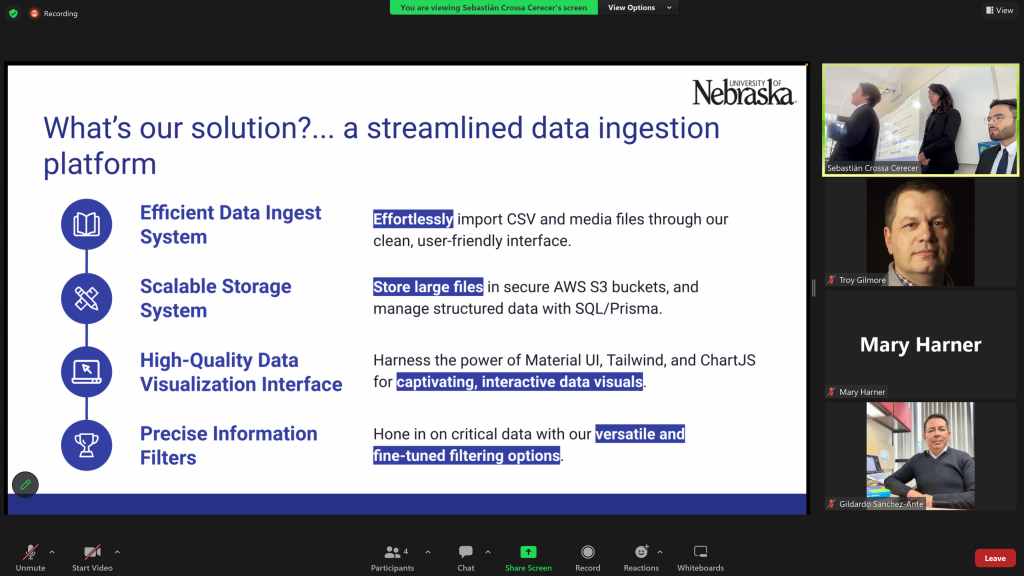
The key deliverables for the KOLA Portal project included the ability to upload and access several types of sensor data, including sound recordings, imagery, and scalar data (e.g., water levels). We met weekly with the KOLA Team. Students led those meetings, providing important updates and proposing next steps. As described in their final presentation, their solution consisted of the following:
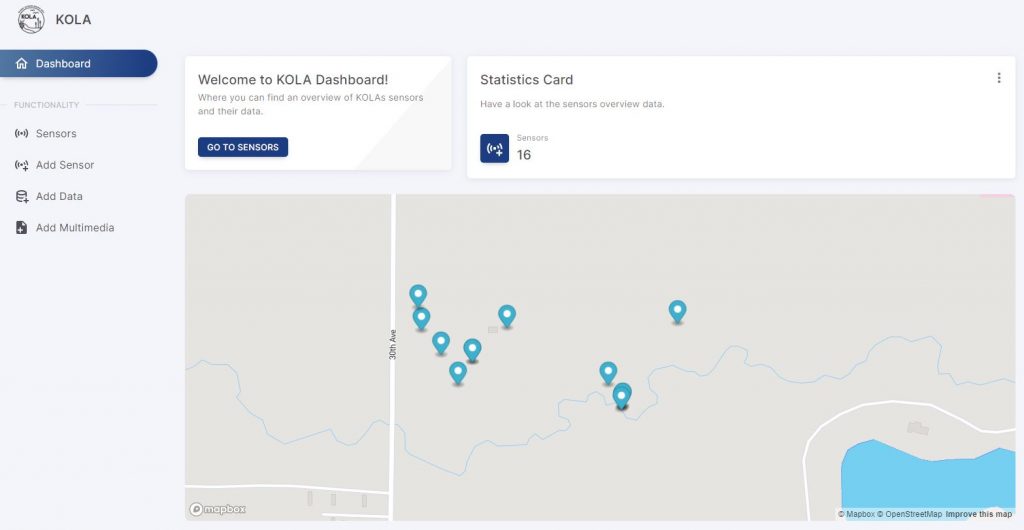
The KOLA Portal has an attractive welcome screen, including a site map showing the various sensors that provide environmental data.
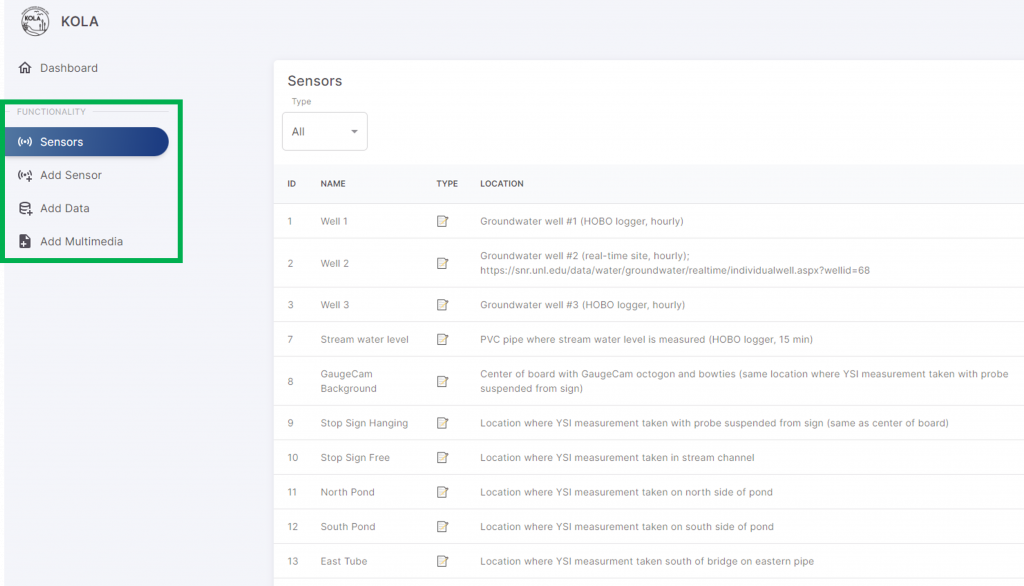
The green rectangle in the screenshot below highlights how we can now navigate from viewing the sensors, to adding a sensor, adding scalar data, and adding multimedia data on the platform.
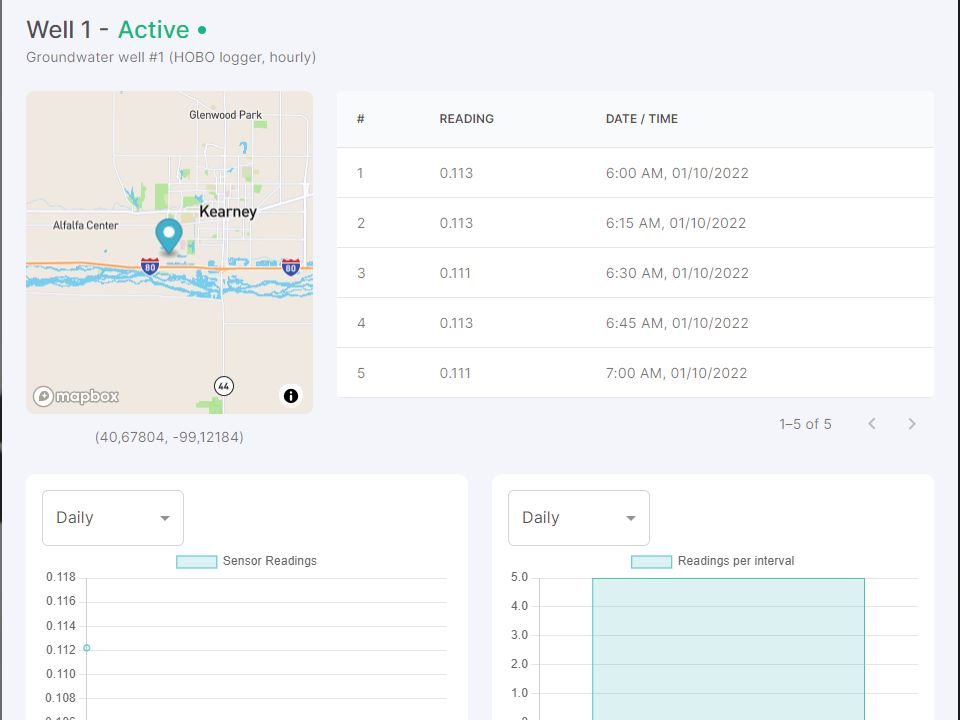
The portal also allows us to view sample data we provided the team, as shown below.
The KOLA Team also provided excellent documentation of the whole project! This was provided in a summary handoff email at the end of the semester. The video below shows the User Manual for the portal. The team also provided (1) an API reference and (2) a deployment guide that walks the user through the process of setting up the environment, navigating the codebase, and deploying the portal with the Next.js framework and Vercel hosting platform.
Overall, the KOLA Data Portal Team were highly productive and very professional. We are very grateful to Professor Elizabeth López Ramos and Professor Gildardo Sánchez Ante for involving us in the course. We learned a lot in the process and would love to work with other ITESM students in the future!
There are six key components to be concerned about when setting up the GaugeCam octagon calibration target in the field.
The facet lengths of the octagon must be the exact same length.
The background in the stream must be mounted orthogonal to the water surface.
The camera should be mounted as directly in front of the background as possible.
Field measurements must be made from the upper left vertex to the water level.
The size of the octagon (in pixels) in the image must be large enough to be detected by the GRIME2 search algorithm.
The thickness (in pixels) of the black border around the octagon must be large enough to be detected.
As you might guess, based on the bold text above, we are focusing on the last two items in this blog post, which are both related to the size of the octagon in images to achieve successful calibration for water level measurement.
To provide guidelines for the octagon dimensions (in pixels) required for successful calibration, we used imagery from the Kearney Outdoor Learning Area (KOLA). The image used was about 1MB when stored as a .jpg, as captured with a Reconyx trail camera.
In this simple test we resampled the images to reduce resolution. As the resolution was reduced, the size of the octagon was reduced. In other words, there were fewer pixels displayed across the width and facet lengths of the octagon. Similarly, the black border around the octagon became more pixelated.
The animation above shows when the octagon search algorithm began to break down as the resolution of the image is decreased. The decrease is represented by the scale annotation in the image. The scale value shown is the size of the image in percentage of the original image size (2304 x 1295 pixels, including the black strips at top and bottom of the image). Major failures of the octagon find and calibration started to occur at less than 60% of the original image resolution. The horizontal width of the blue area in the octagon target is 137 pixels in the 60% image.
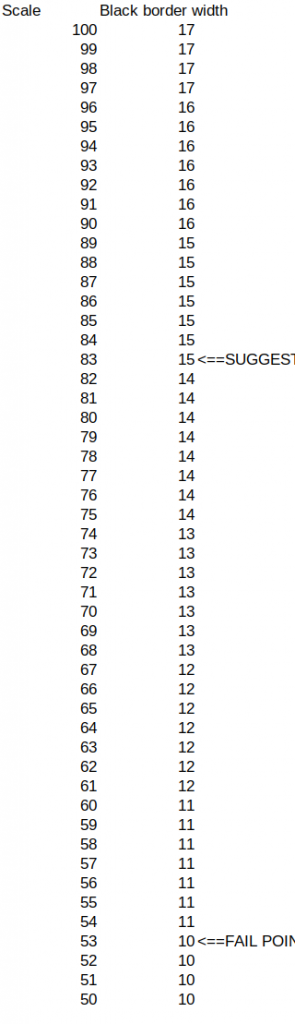
Below is a table showing the desired width of the black border around the octagon. The suggested width for robust detection is 15 pixels, although the 60% image had a width of only about 11 pixels. The width of the black border can be measured in your images using the measurement tool in GRIME2.
The major takeaway here is that, whatever the size of the images captured, the current GRIME2 octagon search and calibration algorithm should be robust for images where the blue part of the octagon is at least 137 pixels wide and the width of the black border is at very minimum 11 pixels wide but preferably at least 15 pixels wide. These values are based on a very simple test with an ideal image. Greater sizes (in pixels) of the octagon target are generally going to be preferable, and the overall performance of the system is still highly dependent on image scene quality (fewer shadows, glare, etc.) and proper installation of the target background in the stream.