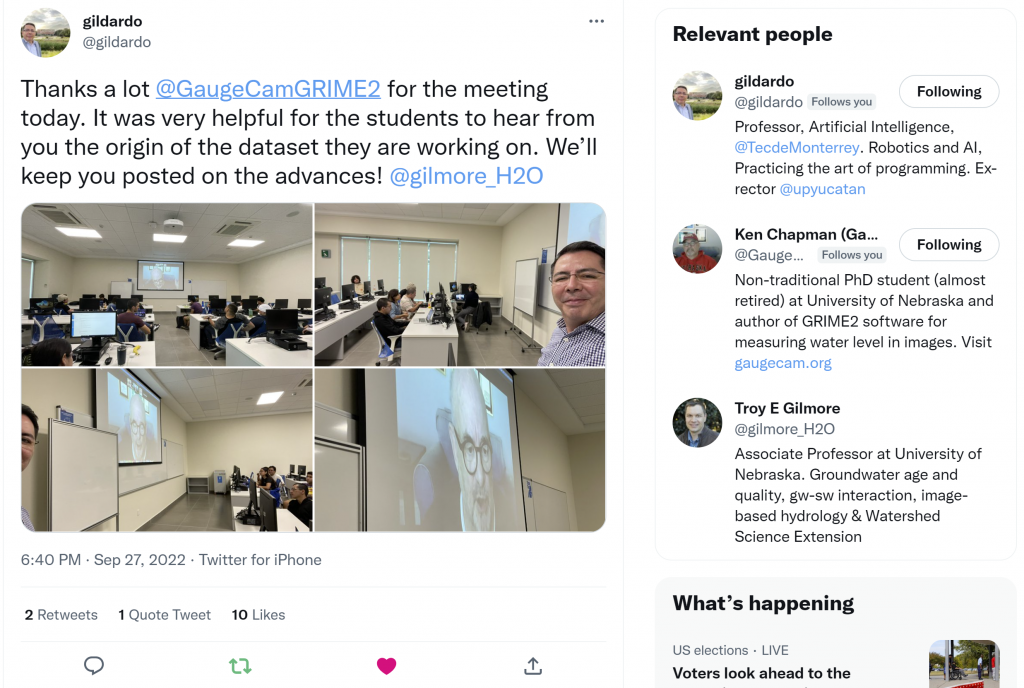
Building on the successful WaterFront Software and KOLA Data Portal projects, we embarked on another student-led adventure in the Fall 2023 semester! Professor Elizabeth López Ramos connected the GRIME Lab team with an excellent student team at Tecnológico de Monterrey (ITESM). These students led the Data Fusion Project.
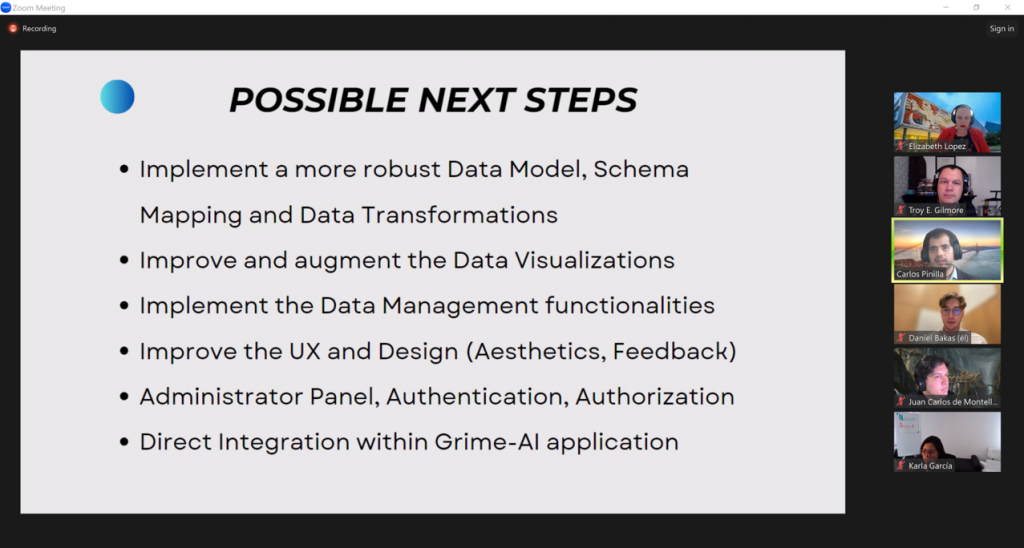
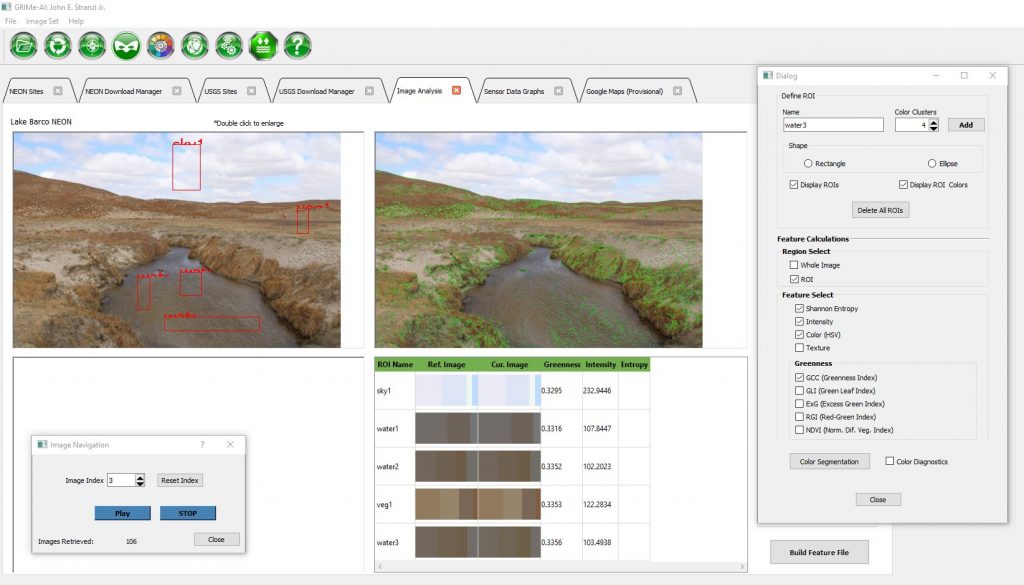
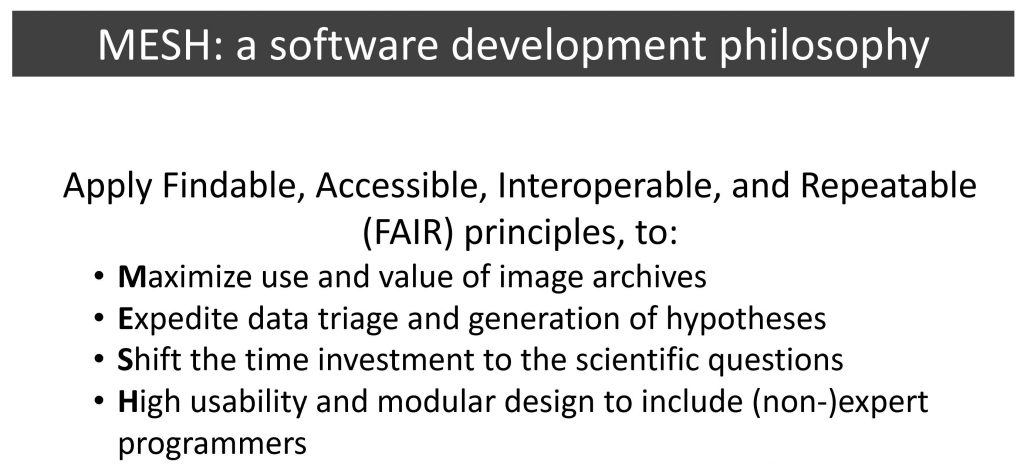
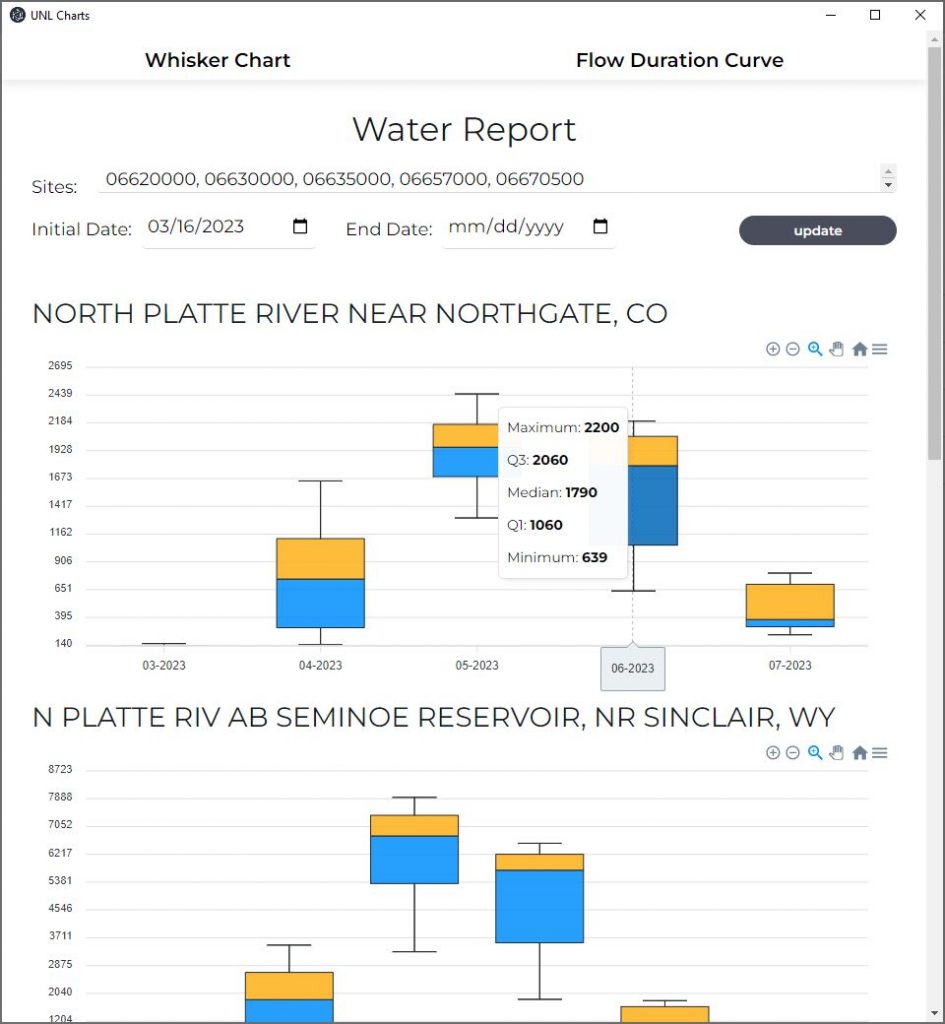
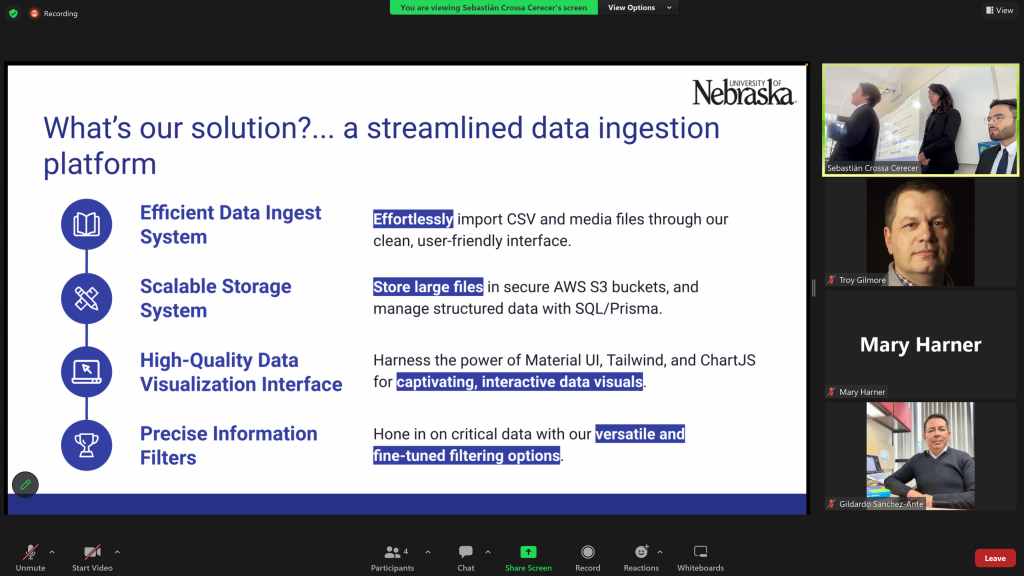
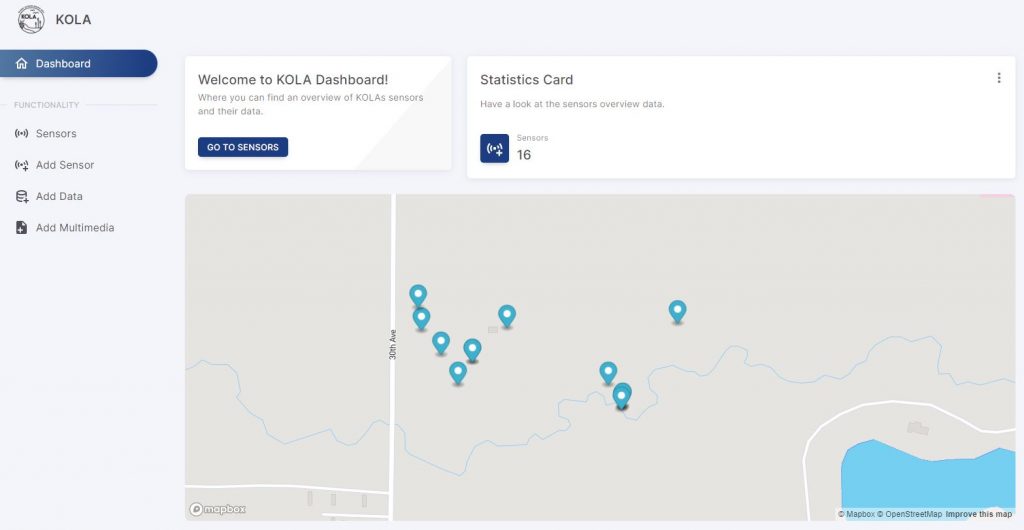
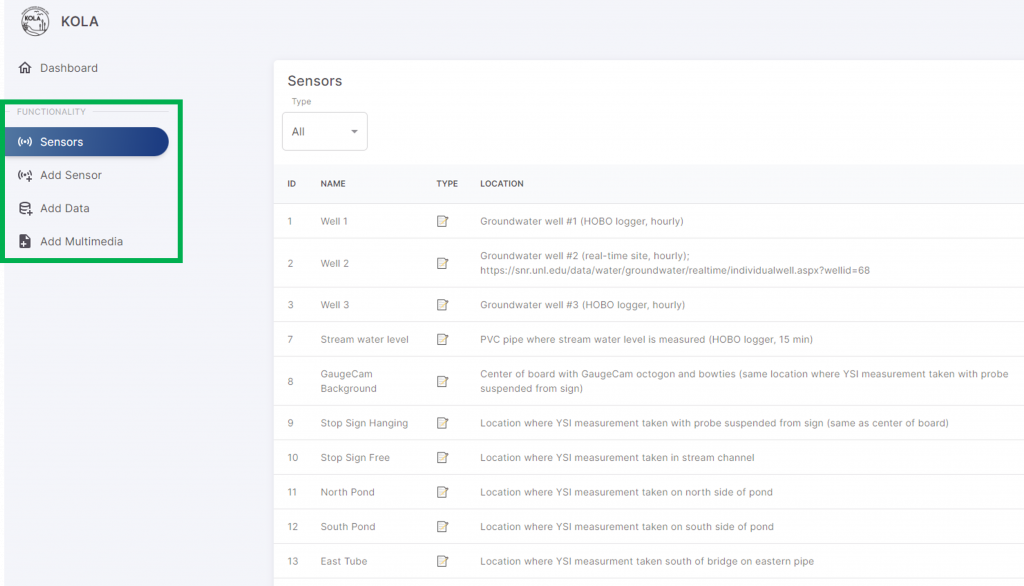
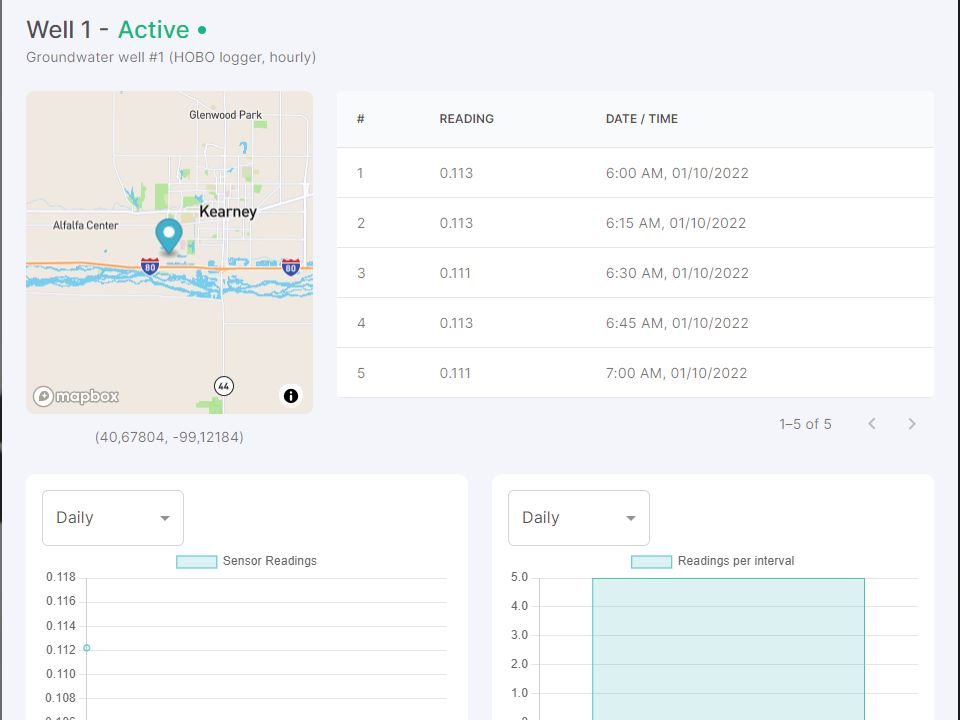
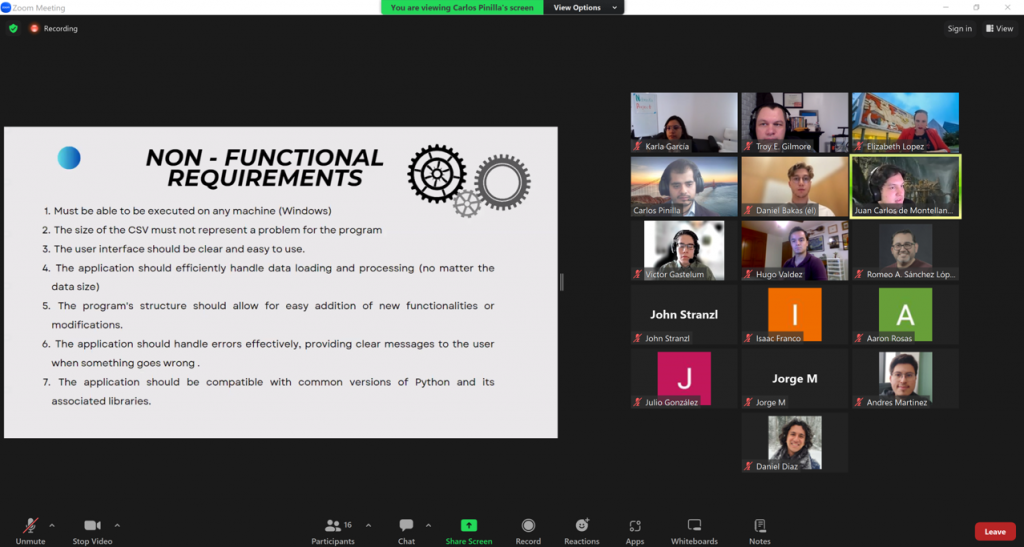
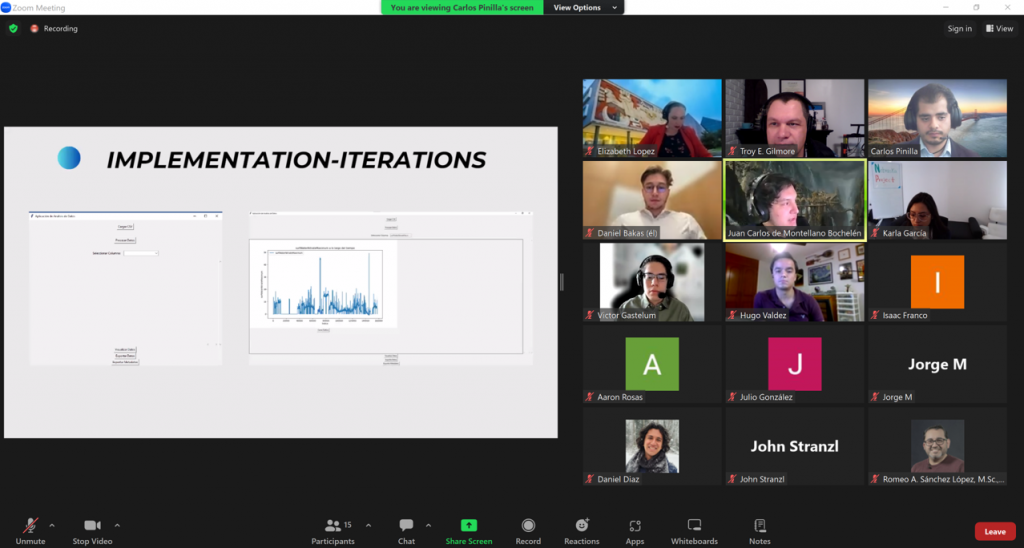
The Data Fusion Project is a first step toward integrating data fusion features in the GRIME-AI user interface. And the ITESM team dived DEEP into the software development life cycle on this one! As “clients” the GRIME Lab team had multiple meetings and filled out an extensive questionnaire. This made us really think through the requirements we desired. The ITESM team extensively documented this process, which is a major benefit to everyone going forward. Below are some screenshots from the ITESM team’s final presentation.
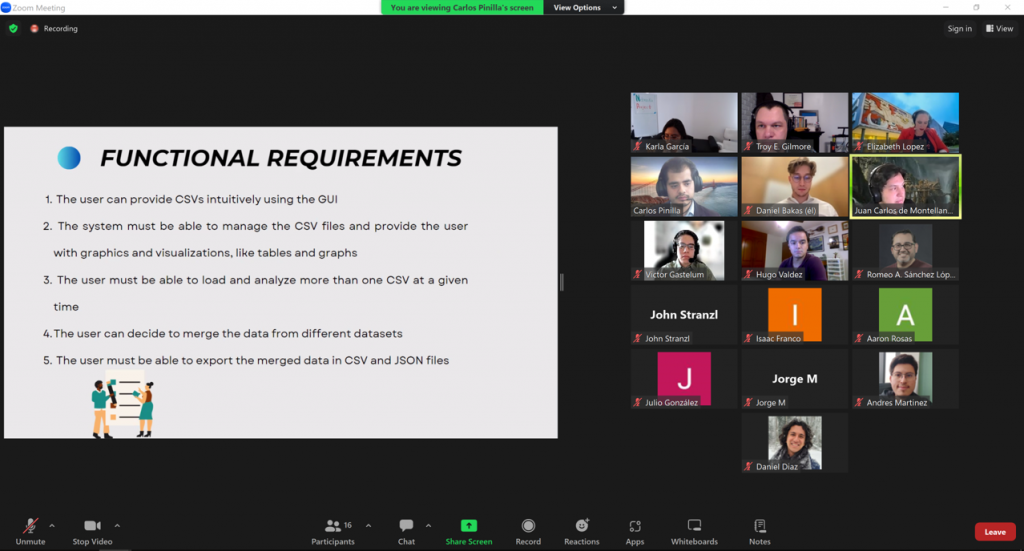
The ITESM did a great job of working across campuses and completing a lot of behind-the-scenes work required to finish this project. Their project can be found on GitHub.
Overall, we are grateful for the opportunity to work with the ITESM Team. They were very professional and worked hard to create a viable product!
Many thanks to:
- Carlos Eduardo Pinilla López
- Daniel Bakas Amuchástegui
- José David Herrera Portillo
- Juan Carlos Ortiz de Montellano Bochelen
- Karla Paola Ruiz García
- Romeo Alfonso Sánchez López
- Víctor Manuel Gastélum Huitzil